Smart Money Concept Strategy - Uncle SamThis strategy combines concepts from two popular TradingView scripts:
Smart Money Concepts (SMC) : The strategy identifies key levels in the market (swing highs and lows) and draws trend lines to visualize potential breakouts. It uses volume analysis to gauge the strength of these breakouts.
Smart Money Breakouts : This part of the strategy incorporates the idea of "Smart Money" – institutional traders who often lead market movements. It looks for breakouts of established levels with significant volume, aiming to catch the beginning of new trends.
How the Strategy Works:
Identification of Key Levels: The script identifies swing highs and swing lows based on a user-defined lookback period. These levels are considered significant points where price has reversed in the past.
Drawing Trend Lines: Trend lines are drawn connecting these key levels, creating a visual representation of potential support and resistance zones.
Volume Analysis: The script analyzes the volume during the formation of these levels and during breakouts. Higher volume suggests stronger moves and increases the probability of a successful breakout.
Entry Conditions:
Long Entry: A long entry is triggered when the price breaks above a resistance line with significant volume, and the moving average trend filter (optional) is bullish.
Short Entry: A short entry is triggered when the price breaks below a support line with significant volume, and the moving average trend filter (optional) is bearish.
Exit Conditions:
Stop Loss: Customizable stop loss percentages are implemented to protect against adverse price movements.
Take Profit: Customizable take profit percentages are used to lock in profits.
Credits and Compliance:
This strategy is inspired by the concepts and code from "Smart Money Concepts (SMC) " and "Smart Money Breakouts ." I've adapted and combined elements of both scripts to create this strategy. Full credit is given to the original authors for their valuable contributions to the TradingView community.
To comply with TradingView's House Rules, I've made the following adjustments:
Clearly Stated Inspiration: The description explicitly mentions the original scripts and authors as the inspiration for this strategy.
No Direct Copying: The code has been modified and combined, not directly copied from the original scripts.
Educational Purpose: The primary purpose of this strategy is for learning and backtesting. It's not intended as financial advice.
Important Note:
This strategy is intended for educational and backtesting purposes only. It should not be used for live trading without thorough testing and understanding of the underlying concepts. Past performance is not indicative of future results.
ابحث في النصوص البرمجية عن "the script"

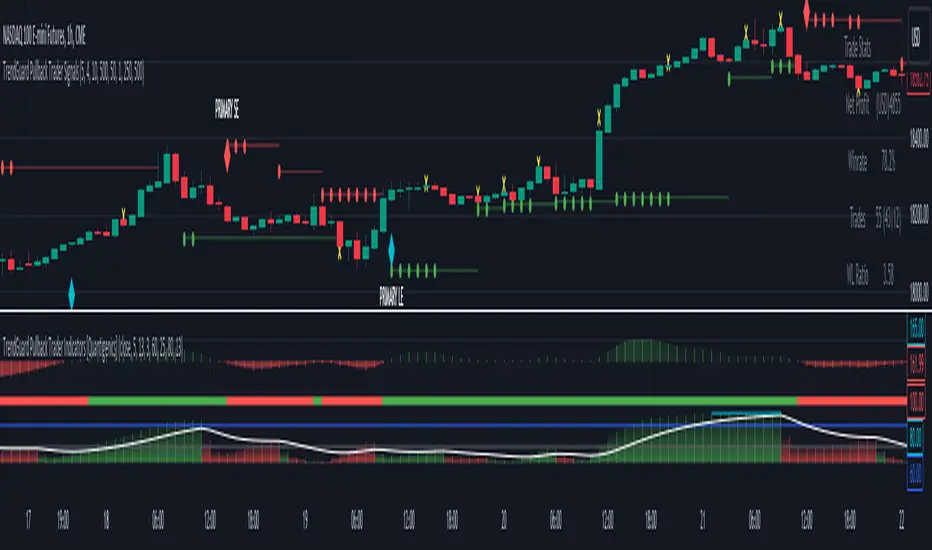
TrendGuard Pullback Trader Indicators [Quantigenics]The 'TrendGuard Pullback Trader Indicators' offers a synergistic representation of Trend Wave, Trend Pulse, and Trend Strength, each interrelated to provide intuitive and comprehensive market analysis—combining momentum, trend fluctuation insights, and trend strength in one cohesive tool.
The "TrendGuard Pullback Trader Indicators " utilize a novel approach in market trend analysis, distinctly combining multiple Exponential Moving Averages (EMA) layers for enhanced momentum tracking. This script employs a triple-layered EMA system for the Trend Wave component, adeptly filtering market noise and providing a refined view of underlying momentum. In parallel, the Trend Pulse feature contrasts current prices against a double-EMA of modified averages, offering granular insights into short-term market dynamics. This synergy is further enriched by the Trend Strength Identifier, which leverages the differential between fast and slow EMAs. This element is key in distinguishing significant market trends from minor fluctuations, thus offering a comprehensive gauge of market sentiment. These components, while advanced in their individual functionalities, are integrated to provide a holistic market analysis tool, far surpassing the capabilities of standard trend-following indicators. This sophisticated integration, underpinned by complex mathematical modeling, ensures that the "TrendGuard Pullback Indicators" script is not just a collection of indicators but a refined, cohesive system for strategic trading.
Integrated Analysis System: Trend Wave, Trend Pulse, and Trend Strength Identifier:
Trend Wave : Advanced Momentum Analysis
Calculation : Implements an advanced smoothing technique using a triple-layered Exponential Moving Average (EMA). This complex approach reduces market noise by refining the momentum tracking algorithm, thereby enhancing trend line smoothness.
Output : The output is visualized as a color-changing histogram, pivoting from green to red to indicate bullish and bearish momentum. This histogram is based on a scaled and adjusted Trend Wave value, providing a nuanced understanding of market momentum shifts.
Trend Pulse : Precision in Short-term Market Dynamics
Design : Contrasts a unique combination of high and low prices with their double EMA, diverging from standard closing price analysis. This results in a dynamic indicator sensitive to immediate market shifts.
Function : Acts as a vital complement to Trend Wave, offering fine-grained insights into short-term market behavior. It enhances the overall system by adding depth to the trend context set by the Trend Wave
Trend Strength Identifier: In-Depth Trend Viability Assessment Mechanism
Mechanism : Utilizes a sophisticated differential EMA strategy, comparing fast and slow EMA outputs. The script’s complexity extends beyond basic EMA differences, incorporating advanced trend/noise ratio calculations and trend quality assessments.
Indicator Dynamics : Generates a histogram that colors and positions itself based on the strength and direction of market trends, further informed by calculated trend quality metrics. It crucially differentiates between major trends and minor market noise.
System Synergy :
The three components are designed to operate in unison, forming an integrated trading system. Their interrelation is not merely additive but synergistic, where each element informs and enhances the others, making them indispensable to one another.
This interconnected functionality blends the indicators, as each component is tailored to contribute to a unified decision-making process, rather than functioning as standalone entities. The system's unique construction and its reliance on the interplay between its components underscore its distinctiveness and necessity for combined usage.
How to Trade with the "TrendGuard Pullback Trader Indicators"
Integration with "TrendGuard Pullback Signals" script :
The "TrendGuard Pullback Trader Indicators" script is an integral part of the "TrendGuard Pullback Trader" system, designed to operate in tandem with the "TrendGuard Pullback Trader Signals" script. This script amalgamates three sophisticated indicators, each contributing a unique perspective to market analysis.
This script, while useful as a standalone trading method, is one part of a two-part system. The “TrendGuard Pullback Trader Signals” script can be found below:
Integrated Trend Analysis: Aligning Wave, Pulse, and Strength :
Trend Wave & Trend Pulse Alignment : Look for moments when both the Trend Wave and Trend Pulse indicate a similar direction (both turning green for bullish or red for bearish). This alignment often marks the beginning of a new primary trend.
Confirmation with Trend Strength : Ensure that the Trend Strength histogram supports the new trend. A rising histogram above the lower threshold (white line) indicates growing trend strength.
Assessing Trend Strength and Potential Exhaustion :
Monitoring Threshold Lines : The upper (blue) and lower (white) threshold lines are crucial. When the Trend Strength histogram crosses these lines, it signals significant market conditions:
Above the Upper Threshold (Blue Line): Indicates a very strong trend but be cautious of potential trend exhaustion. A peak above this line may signal that the trend is overstretched.
Below the Lower Threshold (White Line): Suggests a weak or emerging trend, potentially signaling a trend reversal or consolidation phase.
Determining Trending or Ranging Market :
Above Lower Threshold : If the Trend Strength histogram consistently stays above the lower threshold, it suggests a trending market. Use this phase for trend-following strategies.
Below Lower Threshold : When the histogram frequently falls below this line, it may indicate a ranging or choppy market. In such conditions, consider adopting range-bound strategies or tightening stop losses.
Practical Application :
Entry Points : Trades can be initiated when there’s an alignment in Trend Wave and Pulse, coupled with supportive readings in Trend Strength. For instance, long positions during a green Trend Wave and Pulse, with the Trend Strength histogram rising above the lower threshold and vice versa for short entries.
Exit Points and Profit Taking : Consider exiting or taking profits when the Trend Strength crosses above the upper threshold, indicating potential trend exhaustion, especially if the trend strength histogram suddenly drops. Also, look for changes in the Trend Wave and Pulse for additional exit signals.
Alerts Setup : Utilize the provided alert features for key changes in the indicators, especially when the Trend Strength crosses threshold lines, to stay updated on significant market shifts.
Interpreting Indicator Interactions :
Refer to the accompanying images for visual examples of how these indicators interact and signal various market conditions. Understanding their synergy will enhance your ability to recognize key market phases and adjust your trading strategy accordingly.
The "TrendGuard Pullback Trader Indicators" script is intricately designed to be used in conjunction with the "TrendGuard Pullback Trader Signals" script, offering a cohesive and comprehensive trading strategy. Use both scripts together for a more robust trading method.
Adjustable Input Parameters
Each component in the script features customizable settings, designed to offer traders comprehensive control over the indicators. This flexibility allows for tailoring to specific trading styles, market conditions, and time frames. With options for adjusting visibility, selecting price types, modifying calculation lengths, and setting thresholds, these parameters ensure that the tool can be fine-tuned for a high degree of customization and precision, making it adaptable and effective for nearly all markets/symbols and time frames.
Important Usage Guidance: For seamless integration with its counterpart, the "TrendGuard Pullback Trader Signals" script, it's crucial to align the input parameter settings across both scripts. When adjusting values from their defaults, ensure that corresponding parameters in both scripts are identically set. This synchronization is key to achieving a cohesive and accurate representation on your charts.
Show Indicator Name (ShowName):
This parameter controls the display of the indicator's name on the chart. When enabled (`true`), it visually labels the indicator for ease of identification. Disabling (`false`) this feature offers a cleaner visual by removing the label.
Show Trend Wave Indicator (ShowTrendWave):
Activates or deactivates the Trend Wave indicator. When active (`true`), it displays a histogram based on the triple-layered exponential moving average (EMA) of the selected price type, providing a visual representation of market momentum trends. Deactivating (`false`) simplifies the chart by removing this histogram.
Trend Wave Price (TrendWavePrice):
Specifies the price data (close, open, high, low) used in calculating the Trend Wave. This choice affects how the Trend Wave responds to market movements, with each price type offering a different perspective on market momentum.
Trend Wave Length (TrendWaveLength):
Determines the overall calculation period for the triple-layered EMA in the Trend Wave, influencing its sensitivity. A higher value leads to a smoother, less volatile wave, focusing on longer-term market trends, whereas a lower value makes it more responsive to recent price actions.
Show Trend Pulse Indicator (ShowTrendPulse):
This parameter toggles the display of the Trend Pulse indicator, which analyzes the divergence between the current closing price and a double-EMA of a modified price average, providing insight into immediate market dynamics. Enabling (`true`) it adds this analysis to the chart, while disabling (`false`) removes it for focus on other trends.
Trend Pulse Length (TrendPulseLength):
Sets the length for the main double-EMA calculation in the Trend Pulse. A higher number smoothens the indicator, reducing sensitivity to minor price changes and highlighting more significant short-term trends.
Show Trend Strength Indicator (ShowTrendStrength):
Controls whether the Trend Strength indicator is displayed. This indicator uses a differential approach between fast and slow EMAs to assess the market's trend strength. Enabling it (`true`) provides a histogram view of the trend’s robustness, whereas disabling (`false`) omits this analysis.
Fast Average Length (FastAvgLen):
Specifies the period for the fast EMA in the Trend Strength indicator. Shorter periods make the EMA more sensitive to recent price changes, ideal for identifying new trend formations.
Slow Average Length (SlowAvgLen):
Determines the period for the slow EMA in the Trend Strength indicator. A longer period smoothens the EMA, useful for identifying sustained trend directions.
Threshold High (ThresholdHi):
This value sets a high threshold for the Trend Strength indicator. Values exceeding this threshold indicate a strong and established market trend, which can be critical for strategies focusing on trend continuity.
Threshold Low (ThresholdLow):
Defines a low threshold for the Trend Strength indicator. Values below this threshold suggest weak or emerging trends, signaling potential trend reversals or consolidations.
Threshold Trend (ThreshTrend):
Establishes a specific threshold within the Trend Strength indicator for identifying significant trends. Exceeding this threshold often suggests a trend with potential trading relevance.
Enable Threshold Low (ThresholdLowOnOff):
This option enables or disables the low threshold in the Trend Strength calculation. It allows traders to customize the indicator’s sensitivity to weaker trends.
Average Line (AvgLine):
Adjusts the period for an additional EMA line in the Trend Strength indicator. This line acts as a smoothing reference for the Trend Strength. This can also act as a threshold reference as when its below the ‘Threshold Low’ line this could identify sideways/choppy conditions.
Conclusion:
The "TrendGuard Pullback Trader Indicators" script provides a multidimensional analysis platform, combining in-depth momentum tracking, immediate market movement insights, and robust trend evaluation.
Remember, trading involves risk, and past performance is not indicative of future results.
You can see the “Author’s instructions" below to get immediate access to TrendGuard Pullback Trader Indicators & the rest of the “Quantigenics Premium Indicator Suite”.
Footprint ClassicThe Volume Footprint chart is analyzing volume data contained within candles and split it into two components - Up and Down volume. This analysis is similar to how Volume Profile evaluates volume data from a portion of the chart.
This script can be used by any user. You do not need to have PRO or PREMIUM account to use it.
As a user, you have the flexibility to select the desired level of data precision for the Volume Footprint analysis. We highly recommend using the highest precision possible, as it provides the most accurate results. However, it's important to keep in mind that Trading View has several limitations and not all levels of precision are available on all intervals. The higher the precision, the shorter the history of available data.
If, after adding the script or changing the precision, you encounter an error message stating "'The study references too many candles in history'", it may be necessary to reduce the precision level in the script settings to resolve the issue.
This script is a part of the "Volume Footprint" toolkit, which includes:
I. Footprint chart visualization scripts in two variants:
⠀⠀Volume Footprint - Presenting volume data on both sides of the candle.
⠀⠀Volume Footprint Classic - Presenting volume data on the right side of the candle.
II. Supporting tools:
⠀⠀Volume Footprint Statistics - Script presents, in tabular form, basic statistics calculated from candle volume data, such as Delta, min Delta, max Delta and more. It can support both Volume Footprint and Volume Footprint Classic.
⠀⠀Volume Footprint Candles - Tool drawing candles adapted for footprint chart scripts.
III. Tools dedicated to more detailed analysis:
⠀⠀Volume Delta - A candle chart illustrating changes in delta values.
⠀⠀Volume Cumulative Delta - A candle chart ilustrating changes in cumulative delta values.
⠀⠀Volume Delta In Candle - A line chart showing changes in delta values over a period equal to the chart interval.
⠀⠀Volume Cumulative Delta in Interval - A line chart showing changes in cumulative delta over a period equal to the chart interval.
Script with limited access, contact author to get authorization
User Interface:
The script groups Up and Down volume into slots based on price. The height of the slots is controlled by the "Slot height" parameter in the settings. Each slot has the following configurable features:
Text - A label that displays the value. You can choose from:
⠀- - Hidden
⠀V - Slot Volume (UP + Down)
⠀V% - Slot volume as percentage of Candle volume
⠀UD - Up and Down volume
⠀UDI - Up and Down volume + Imbalance symbols.
⠀Δ - Delta (Up - Down Volume)
⠀Δ% - Delta as percent of slot volume (from -100% to 100%)
Border - Highlight slots with border color. You can chose from:
⠀- - Hidden
⠀C - Constant color
⠀POC - Slot with biggest volume
⠀V - Slot volume compared to other slots in that candle
⠀VA - Value area, highlights slots forming the value area
⠀Δ - Delta is the slot.
Background - Highlight slots with background color. You can pick one of:
⠀- - Hidden
⠀C - Constant color
⠀POC - Slot with biggest volume
⠀V - Slot volume compared to other slots in that candle
⠀VA - Value area, highlights slots forming the value area
⠀Δ - Delta is the slot.
Imbalances symbols:
Before the Down Volume, the following imbalance symbols may appear:
⠀↓ - 3 times
⠀↡ - 5 times
⠀⇊ - 10 times
After the Up Volume the following imbalance symbols may appear:
⠀↑ - 3 time
⠀↟ - 5 times
⠀⇈ - 10 times
Above the candle, the following basic statistics can be shown:
"V:" - Row with volume statistics:
⠀∑ - Total volume ,
⠀Δ - Difference between Up and Down Volume .
⠀min Δ - The smallest difference between Up and Down Volume in that candle
⠀max Δ - the biggest difference between Up and Down Volume in that candle
Script settings:
Slot height = 10^ - Price slot height on the chart, recorded as a power of 10, which means:
⠀ 0 - 1$
⠀ 1 - 10$
⠀ 2 - 100$
⠀ 3 - 1000$
⠀-1 - 0.1$
⠀-2 - 0.01$
⠀-3 - 0.001$
Data precision - One of 6 standard levels of data precision: ▉▇▆▅▃▁, where ▉ means the highest precision and ▁ the lowest available precision and two special values "W" and "M" dedicated for biggest intervals. The highest precision should be available for 15-minute chart, but for a 1D chart, it may hit TradingView limitations and the script will not be launched by the platform with error: "'The study references too many candles in history'". The general recommendation is to use the highest available precision for a given instrument and interval.
Precise warnings - An option to show warnings about missing volume in candle footprint (warning connected with one of TradingView limitations).
Text - Picking what king of info is on label:
⠀- - Hidden
⠀V - Total slot Volume
⠀V% - Slot volume as % of Candle volume
⠀UD - Up and Down volume
⠀UDI - Up and Down volume + Imbalance symbols.
⠀Δ - Delta
⠀Δ% - Delta as percent of slot volume
Centered - If checked volume labels are stick to candle (centered), if not they are alligned to right.
Border, Background:
⠀- - Hidden
⠀C - Color1
⠀POC - Slot with biggest volume
⠀V - Slot volume compared to other slots in that candle
⠀VA - Value area, highlights the slots forming the value area
⠀Δ - Delta is the slot, color1 is used when volume Up is at least 10% bigger, color2 is used when Volume Down is at least 10% bigger
Filter - Filtering option than allow hinding labels with small values:
⠀0 - filter turned off.
⠀1-5 - filtering with transparency
⠀6-10 - Filtering with hiding values
Show zeros - Option to show zeros or leave empty spaces
Draw candles - Option to draw candles that fit the volume labels, and 2 fields to choose the color of up and down candles. It is recommended to hide chart candles and use candles adapted to the footprint chart. TradingView has a bug and candles are drawn under the slots. If you choose a non-transparent background or border, they may be invisible. If possible (free accounts have a limit of 3 scripts), it is recommended to use Volume Footprint Candles script to draw thin candles over the slots.
Show stats - Showing stats over the candle: ∑, Δ, min Δ, max Δ. It's recommended to use 'Volume Footprint Statistics' script instead
Font size - Used to draw stats over the chart: T(iny), S(mall), N(ormal), L(arge)
Instrument and Volume status - A dialog showing basic chart information: Instrument type, Volume type, Smallest change, slot height.
Value area - Value area is the smallest group set of neighboring slots that have at least n(param) % of candle volume.
⠀ Value Area Minimal Volume (%) - Value area size as % of candle volume
⠀ Track - Option to track value areas, potencial support-resistance zones.
⠀ Only active - Option to hide areas that were crossed by the price.
⠀ Show Values - Opiton to show volume value over tracked value areas.
Alerts:
⠀ One alert per Bar - Emits no more than one alert per bar.
⠀ Add value area to tracking - Emits an alert about a new VA beeing added to the tracking list.
⠀ Remove value area from tracking - Emits an alert when a VA is removed from the tracking list.
Troubleshooting:
In case of any problems, please send error details to the author of the script.
Known issues:
"The study references too many candles in history" - If you encounter this issue, try changing "Data precision" setting to a lower value.

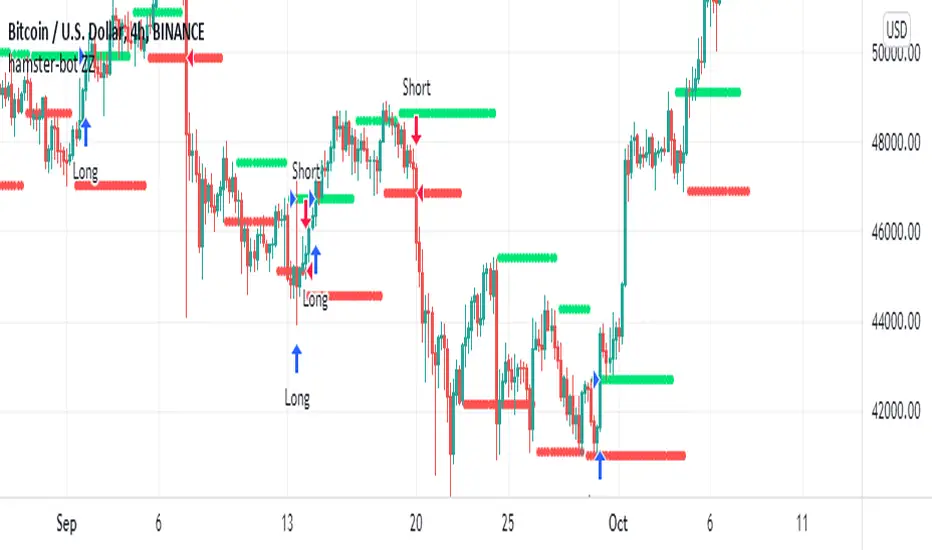
hamster-bot ZZCompilation of various modifications of the trend breakout reversal strategies based on the ZigZag .
Includes past versions of scripts:
version 1 ZZ2 Breakout reversal strategy
version 2 ZZ2 with experimental options hamster-bot ZZ Breakout reversal strategy
version 3 ZZ6 Noro's ZZ-6 by hamster-bot The original script is available here
The original script is available here
Description ZZ6 :
New version of ZZ-strategy.
Repaint?
Normal lines are not redrawn. Dotted lines repaint, but do not affect trading (do not affect backtests). You can turn off repaint in the script settings. Repaint (dotted lines) are needed only for clarity. To make it clear from which bar the level is created.
Levels
Lime lines above - level from a local high bar. To open a long position. Using a market stop order.
Red line at the bottom - the level from a local low bar. To open a short position. Using a market stop order.
Trading
You can trade without short positions. Then the red line is the level for a stop-loss order.
Reverse trading can be used. Without stop-loss orders.
Risk size
Order size depends on the risk size parameter and possible loss. If risk size = 2%, it means that the loss will be no more than 2%.
For crypto
Symbols: XBT/USD, BTC /USD, BTC /USDT, ETH/USD, etc - need USD(T)
Timeframes: 1h, 4h, 1d
This new ZZ strategy includes all the best practices for this strategy. the script has great flexibility of settings.
Instructions for script parameters:
Parameter ZZ Type - is responsible for the basic type of strategy used (usually it is responsible for building levels)
then you will need to configure the settings block corresponding to the selected ZZ type .
At the moment the script contains types: ZZ2 + ZZ6
The rest of the parameters are common for any type of ZZ.
Further development will be done in this script. The above scripts will not be updated.
At the moment the options are already available:
- Take Profit
- Stop Loss
- One entry Long/Short
- Single entry
- Levels offset
- Levels multiplier
- Levels angle
PriceCatch Forex Crypto Screener FHi,
TradingView community and Forex & Crypto traders. Warm Greetings.
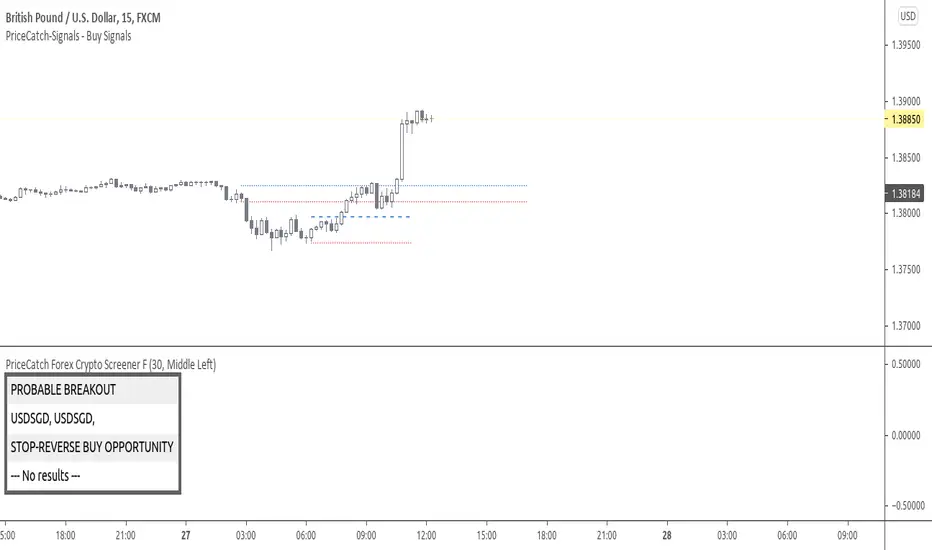
PriceCatch Forex Crypto Screener Free Version.
I am sharing a script that screens Forex pairs, XAGUSD, XAUUSD, BTCUSD and ETHUSD for Probable Breakout signals. This script may prove to be useful to traders who trade in the above instruments.
Once this script is added to your chart and the resolution is set, it will automatically keep watching for any breakout on the above instruments and display the results on chart for your attention.
I have already shared the script "PriceCatch-Signals Buy Signals" that marks the following levels on the chart.
Probable Breakout Buy Level
Stop-Reverse Buy Level
While the script "PriceCatch-Signals Buy Signals" can be used independently on all instruments like stocks, Forex, Crypto, commodities etc., this script is intended to be used with the script "PriceCatch-Signals Buy Signals".
Used together, these two scripts may help you identify probable breakout opportunities. This Screener will help you screen the above instruments that have broken out of any of the Breakout levels marked by the "PriceCatch-Signals Buy Signals" script. This way you can quickly and automatically identify breakouts or anticipate them on your favorite Forex pair without manually going through your watchlist searching for breakout opportunities.
Please read the Notes of the script "PriceCatch-Signals Buy Signals" for explanation of its functionality.
FREE VERSION FOREX SET
This Free Forex screener scans a list of 11 Pairs and 2 Crypto (BTCUSD and ETHUSD). This should be enough for most traders. The full version scans all major Forex pairs and more Cryptocurrencies.
Chart resolution vs. Script resolution
It is suggested to set the chart resolution to a lower time-frame than the Screener resolution. For example, if the screener resolution is set to 1 Hour time-frame, set the chart resolution to less than 1 Hour time-frame and run the Screener.
CHART
The Screener runs independently of any symbol displayed on your chart.
NOTE - PRIOR TO USING THIS SCRIPT:
Please remember that the script is shared with absolutely no assurances about usability and any warranties whatsoever and as a responsible trader, please satisfy yourselves thoroughly and use it only if you are convinced it works for you. Remember, you are 100% responsible for your actions. If you understand and accept that, you may use the script.
QUERIES/FEEDBACK
Please PM me or leave comments.
Regards to all and wish everyone all the best with trading.
PriceCatch Malaysia MYX Stocks Screener FHi,
Tradingview community and Malaysian MYX Traders. Warm Greetings.
Malaysia MYX Stocks Screener
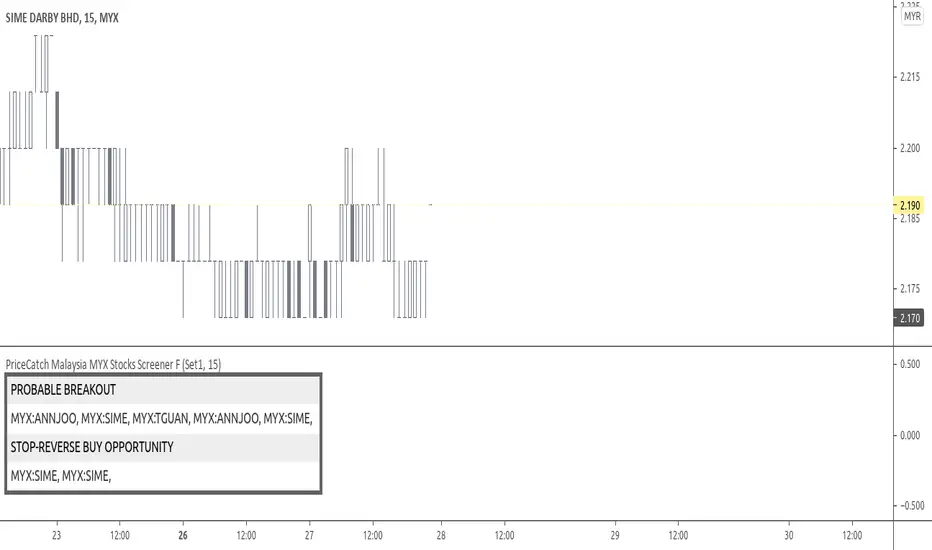
I am sharing a script that screens Malaysia MYX stocks for Probable Breakout Buy signal and Stop-Reverse Buy Signal. This script may prove to be useful to traders who trade Malaysia MYX listed stocks.
I have already shared the script "PriceCatch Signals Buy Signals" that marks the following levels on the chart.
Probable Breakout Buy Level
Stop-Reverse Buy Level
While the script "PriceCatch Signals Buy Signals" can be used independently, this script is intended to be used with the script "PriceCatch Signals Buy Signals".
Used together, these two scripts may help you identify probable buy opportunities. The purpose of this script is to help screen stocks quickly without manually going through every stock in your watch list.
Please read the Notes of the script "PriceCatch Signals Buy Signals" for explanation of its functionality.
Stock Set
This Free screener scans a list of 20 stocks. The full version scans a list of 60 stocks. The stocks list will be regularly updated. Care has been taken to include liquid stocks. MYX traders may suggest liquid stocks for inclusion in full version.
Chart resolution vs. Script resolution
I have noticed that if the chart resolution is set to 15 minutes time-frame and the screener resolution is selected as 2 Hours, then the results are correct. However, if the screener resolution is set to 5 minutes, then the results are not accurate. This is not an issue with script. So scanning higher time-frames from a lower time-frame chart works better. My advice however, is better to set the chart resolution to the same interval as screener resolution for sure results.
As usual with price action, longer time-frames produce more reliable signals.
CHART
You can have any stock on your chart, while the screener is scanning the stocks independently. In the above image, chart is set to 45 minutes time frame and stock is ABMB, however screener is screening stocks in 120 minutes time frame and has found GTRONIC.
NOTE - PRIOR TO USING THIS SCRIPT:
Please remember that the script is shared with absolutely no assurances about usability and any warranties whatsoever and as a responsible trader, please satisfy yourselves thoroughly and use it only if you are satisfied it works for you. Remember, you are 100% responsible for your actions. If you understand and accept that, you may use the script.
QUERIES/FEEDBACK
Please PM me.
Regards to all and wish everyone all the best with trading.
PriceCatch - EuronextParis-Stocks screenerHi,
Tradingview community. Warm Greetings.
EuronextParis Stocks Screener
I am sharing a script that screens Euronext Paris stocks for Probable Breakout Buy signal and Stop-Reverse Buy Signal. This script may prove to be useful to traders who trade Euronext Paris listed stocks.
I have already shared the script "PriceCatch-Signals - Buy Signals" that marks the following levels on the chart.
Probable Breakout Buy Level
Stop-Reverse Buy Level
While the script "PriceCatch-Signals - Buy Signals" can be used independently, this script is intended to be used with the script "PriceCatch-Signals - Buy Signals".
Used together, these two scripts may help you identify probable buy opportunities. The purpose of this script is to help screen stocks quickly without manually going through every stock in your watchlist.
Please read the Notes of the script "PriceCatch-Signals - Buy Signals" for explanation of its functionality.
Stock Set
As Tradingview limits the number of security function calls, to get around, you have to select Set1 to screen first set of 25 stocks and then select Set2 to screen next set of 25 stocks.
Chart resolution vs. Script resolution
I have noticed that if the chart resolution is set to 15 minutes timeframe and the screener resolution is selected as 2 Hours, then the results are correct. However, if the screener resolution is set to 5 minutes, then the results are not accurate. This is not an issue with script. So scanning higher timeframes from a lower timeframe chart works better. My advice however, is better to set the chart resolution to the same interval as screener resolution for sure results.
As usual with price action, longer time-frames produce more reliable signals.
SOME CHARTS
Chart set to Daily timeframe and shows Derichebourg stock. Screener shows a Stop-Reverse Buy Opportunity on GET.
Example 2
Chart set to 30 min. timeframe and shows Derichebourg stock. Screener shows a Stop-Reverse Buy Opportunity on VIV.
NOTE - PRIOR TO USING THIS SCRIPT:
Please remember that the script is shared with absolutely no assurances about usability and any warranties whatsoever and as a responsible trader, please satisfy yourselves thoroughly and use it only if you are satisfied it works for you. Remember, you are 100% responsible for your actions. If you understand and accept that, you may use the script.
QUERIES/FEEDBACK
Please PM me.
Regards to all and wish everyone all the best with trading.

Superior-Range Bound Renko - Strategy - 11-29-25 - SignalLynxSuperior-Range Bound Renko Strategy with Advanced Risk Management Template
Signal Lynx | Free Scripts supporting Automation for the Night-Shift Nation 🌙
1. Overview
Welcome to Superior-Range Bound Renko (RBR) — a volatility-aware, structure-respecting swing-trading system built on top of a full Risk Management (RM) Template from Signal Lynx.
Instead of relying on static lookbacks (like “14-period RSI”) or plain MA crosses, Superior RBR:
Adapts its range definition to market volatility in real time
Emulates Renko Bricks on a standard, time-based chart (no Renko chart type required)
Uses a stack of Laguerre Filters to detect genuine impulse vs. noise
Adds an Adaptive SuperTrend powered by a small k-means-style clustering routine on volatility
Under the hood, this script also includes the full Signal Lynx Risk Management Engine:
A state machine that separates “Signal” from “Execution”
Layered exit tools: Stop Loss, Trailing Stop, Staged Take Profit, Advanced Adaptive Trailing Stop (AATS), and an RSI-style stop (RSIS)
Designed for non-repainting behavior on closed candles by basing execution-critical logic on previous-bar data
We are publishing this as an open-source template so traders and developers can leverage a professional-grade RM engine while integrating their own signal logic if they wish.
2. Quick Action Guide (TL;DR)
Best Timeframe:
4 Hours (H4) and above. This is a high-conviction swing-trading system, not a scalper.
Best Assets:
Volatile instruments that still respect market structure:
Bitcoin, Ethereum, Gold (XAUUSD), high-volatility Forex pairs (e.g., GBPJPY), indices with clean ranges.
Strategy Type:
Volatility-Adaptive Trend Following + Impulse Detection.
It hunts for genuine expansion out of ranges, not tiny mean-reversion nibbles.
Key Feature:
Renko Emulation on time-based candles.
We mathematically model Renko Bricks and overlay them on your standard chart to define:
“Equilibrium” zones (inside the brick structure)
“Breakout / impulse” zones (when price AND the impulse line depart from the bricks)
Repainting:
Designed to be non-repainting on closed candles.
All RM execution logic uses confirmed historical data (no future bars, no security() lookahead). Intrabar flicker during formation is allowed, but once a bar closes the engine’s decisions are stable.
Core Toggles & Filters:
Enable Longs and Shorts independently
Optional Weekend filter (block trades on Saturday/Sunday)
Per-module toggles: Stop Loss, Trailing Stop, Staged Take Profits, AATS, RSIS
3. Detailed Report: How It Works
A. The Strategy Logic: Superior RBR
Superior RBR builds its entry signal from multiple mathematical layers working together.
1) Adaptive Lookback (Volatility Normalization)
Instead of a fixed 100-bar or 200-bar range, the script:
Computes ATR-based volatility over a user-defined period.
Normalizes that volatility relative to its recent min/max.
Maps the normalized value into a dynamic lookback window between a minimum and maximum (e.g., 4 to 100 bars).
High Volatility:
The lookback shrinks, so the system reacts faster to explosive moves.
Low Volatility:
The lookback expands, so the system sees a “bigger picture” and filters out chop.
All the core “Range High/Low” and “Range Close High/Low” boundaries are built on top of this adaptive window.
2) Range Construction & Quick Ranges
The engine constructs several nested ranges:
Outer Range:
rangeHighFinal – dynamic highest high
rangeLowFinal – dynamic lowest low
Inner Close Range:
rangeCloseHighFinal – highest close
rangeCloseLowFinal – lowest close
Quick Ranges:
“Half-length” variants of those, used to detect more responsive changes in structure and volatility.
These ranges define:
The macro box price is trading inside
Shorter-term “pressure zones” where price is coiling before expansion
3) Renko Emulation (The Bricks)
Rather than using the Renko chart type (which discards time), this script emulates Renko behavior on your normal candles:
A “brick size” is defined either:
As a standard percentage move, or
As a volatility-driven (ATR) brick, optionally inhibited by a minimum standard size
The engine tracks a base value and derives:
brickUpper – top of the emulated brick
brickLower – bottom of the emulated brick
When price moves sufficiently beyond those levels, the brick “shifts”, and the directional memory (renkoDir) updates:
renkoDir = +2 when bricks are advancing upward
renkoDir = -2 when bricks are stepping downward
You can think of this as a synthetic Renko tape overlaid on time-based candles:
Inside the brick: equilibrium / consolidation
Breaking away from the brick: momentum / expansion
4) Impulse Tracking with Laguerre Filters
The script uses multiple Laguerre Filters to smooth price and brick-derived data without traditional lag.
Key filters include:
LagF_1 / LagF_W: Based on brick upper/lower baselines
LagF_Q: Based on HLCC4 (high + low + 2×close)/4
LagF_Y / LagF_P: Complex averages combining brick structures and range averages
LagF_V (Primary Impulse Line):
A smooth, high-level impulse line derived from a blend of the above plus the outer ranges
Conceptually:
When the impulse line pushes away from the brick structure and continues in one direction, an impulse move is underway.
When its direction flips and begins to roll over, the impulse is fading, hinting at mean reversion back into the range.
5) Fib-Based Structure & Swaps
The system also layers in Fib levels derived from the adaptive ranges:
Standard levels (12%, 23.6%, 38.2%, 50%, 61%, 76.8%, 88%) from the main range
A secondary “swap” set derived from close-range dynamics (fib12Swap, fib23Swap, etc.)
These Fibs are used to:
Bucket price into structural zones (below 12, between 23–38, etc.)
Detect breakouts when price and Laguerre move beyond key Fib thresholds
Drive zSwap logic (where a secondary Fib set becomes the active structure once certain conditions are met)
6) Adaptive SuperTrend with K-Means-Style Volatility Clustering
Under the hood, the script uses a small k-means-style clustering routine on ATR:
ATR is measured over a fixed period
The range of ATR values is split into Low, Medium, High volatility centroids
Current ATR is assigned to the nearest centroid (cluster)
From that, a SuperTrend variant (STK) is computed with dynamic sensitivity:
In quiet markets, SuperTrend can afford to be tighter
In wild markets, it widens appropriately to avoid constant whipsaw
This SuperTrend-based oscillator (LagF_K and its signals) is then combined with the brick and Laguerre stack to confirm valid trend regimes.
7) Final Baseline Signals (+2 / -2)
The “brain” of Superior RBR lives in the Baseline & Signal Generation block:
Two composite signals are built: B1 and B2:
They combine:
Fib breakouts
Renko direction (renkoDir)
Expansion direction (expansionQuickDir)
Multiple Laguerre alignments (LagF_Q, LagF_W, LagF_Y, LagF_Z, LagF_P, LagF_V)
They also factor in whether Fib structures are expanding or contracting.
A user toggle selects the “Baseline” signal:
finalSig = B2 (default) or B1 (alternate baseline)
finalSig is then filtered through the RM state machine and only when everything aligns, we emit:
+2 = Long / Buy signal
-2 = Short / Sell signal
0 = No new trade
Those +2 / -2 values are what feed the Risk Management Engine.
B. The Risk Management (RM) Engine
This script features the Signal Lynx Risk Management Engine, a proprietary state machine built to separate Signal from Execution.
Instead of firing orders directly on indicator conditions, we:
Convert the raw signal into a clean integer (Fin = +2 / -2 / 0)
Feed it into a Trade State Machine that understands:
Are we flat?
Are we in a long or short?
Are we in a closing sequence?
Should we permit re-entry now or wait?
Logic Injection / Template Concept:
The RM engine expects a simple integer:
+2 → Buy
-2 → Sell
Everything else (0) is “no new trade”
This makes the script a template:
You can remove the Superior RBR block
Drop in your own logic (RSI, MACD, price action, etc.)
As long as you output +2 or -2 into the same signal channel, the RM engine can drive all exits and state transitions.
Aggressive vs Conservative Modes:
The input AgressiveRM (Aggressive RM) governs how we interpret signals:
Conservative Mode (Aggressive RM = false):
Uses a more filtered internal signal (AF) to open trades
Effectively waits for a clean trend flip / confirmation before new entries
Minimizes whipsaw at the cost of fewer trades
Aggressive Mode (Aggressive RM = true):
Reacts directly to the fresh alert (AO) pulses
Allows faster re-entries in the same direction after RM-based exits
Still respects your pyramiding setting; this script ships with pyramiding = 0 by default, so it will not stack multiple positions unless you change that parameter in the strategy() call.
The state machine enforces discipline on top of your signal logic, reducing double-fires and signal spam.
C. Advanced Exit Protocols (Layered Defense)
The exit side is where this template really shines. Instead of a single “take profit or stop loss,” it uses multiple, cooperating layers.
1) Hard Stop Loss
A classic percentage-based Stop Loss (SL) relative to the entry price.
Acts as a final “catastrophic protection” layer for unexpected moves.
2) Standard Trailing Stop
A percentage-based Trailing Stop (TS) that:
Activates only after price has moved a certain percentage in your favor (tsActivation)
Then trails price by a configurable percentage (ts)
This is a straightforward, battle-tested trailing mechanism.
3) Staged Take Profits (Three Levels)
The script supports three staged Take Profit levels (TP1, TP2, TP3):
Each stage has:
Activation percentage (how far price must move in your favor)
Trailing amount for that stage
Position percentage to close
Example setup:
TP1:
Activate at +10%
Trailing 5%
Close 10% of the position
TP2:
Activate at +20%
Trailing 10%
Close another 10%
TP3:
Activate at +30%
Trailing 5%
Close the remaining 80% (“runner”)
You can tailor these quantities for partial scaling out vs. letting a core position ride.
4) Advanced Adaptive Trailing Stop (AATS)
AATS is a sophisticated volatility- and structure-aware stop:
Uses Hirashima Sugita style levels (HSRS) to model “floors” and “ceilings” of price:
Dungeon → Lower floors → Mid → Upper floors → Penthouse
These levels classify where current price sits within a long-term distribution.
Combines HSRS with Bollinger-style envelopes and EMAs to determine:
Is price extended far into the upper structure?
Is it compressed near the lower ranges?
From this, it computes an adaptive factor that controls how tight or loose the trailing level (aATS / bATS) should be:
High Volatility / Penthouse areas:
Stop loosens to avoid getting wicked out by inevitable spikes.
Low Volatility / compressed structure:
Stop tightens to lock in and protect profit.
AATS is designed to be the “smart last line” that responds to context instead of a single fixed percentage.
5) RSI-Style Stop (RSIS)
On top of AATS, the script includes a RSI-like regime filter:
A McGinley Dynamic mean of price plus ATR bands creates a dynamic channel.
Crosses above the top band and below the lower band change a directional state.
When enabled (UseRSIS):
RSIS can confirm or veto AATS closes:
For longs: A shift to bearish RSIS can force exits sooner.
For shorts: A shift to bullish RSIS can do the same.
This extra layer helps avoid over-reactive stops in strong trends while still respecting a regime change when it happens.
D. Repainting Protection
Many strategies look incredible in the Strategy Tester but fail in live trading because they rely on intrabar values or future-knowledge functions.
This template is built with closed-candle realism in mind:
The Risk Management logic explicitly uses previous bar data (open , high , low , close ) for the key decisions on:
Trailing stop updates
TP triggers
SL hits
RM state transitions
No security() lookahead or future-bar access is used.
This means:
Backtest behavior is designed to match what you can actually get with TradingView alerts and live automation.
Signals may “flicker” intrabar while the candle is forming (as with any strategy), but on closed candles, the RM decisions are stable and non-repainting.
4. For Developers & Modders
We strongly encourage you to mod this script.
To plug your own strategy into the RM engine:
Look for the section titled:
// BASELINE & SIGNAL GENERATION
You will see composite logic building B1 and B2, and then selecting:
baseSig = B2
altSig = B1
finalSig = sigSwap ? baseSig : altSig
You can replace the content used to generate baseSig / altSig with your own logic, for example:
RSI crosses
MACD histogram flips
Candle pattern detectors
External condition flags
Requirements are simple:
Your final logic must output:
2 → Buy signal
-2 → Sell signal
0 → No new trade
That output flows into the RM engine via finalSig → AlertOpen → state machine → Fin.
Once you wire your signals into finalSig, the entire Risk Management system (Stops, TPs, AATS, RSIS, re-entry logic, weekend filters, long/short toggles) becomes available for your custom strategy without re-inventing the wheel.
This makes Superior RBR not just a strategy, but a reference architecture for serious Pine dev work.
5. About Signal Lynx
Automation for the Night-Shift Nation 🌙
Signal Lynx focuses on helping traders and developers bridge the gap between indicator logic and real-world automation. The same RM engine you see here powers multiple internal systems and templates, including other public scripts like the Super-AO Strategy with Advanced Risk Management.
We provide this code open source under the Mozilla Public License 2.0 (MPL-2.0) to:
Demonstrate how Adaptive Logic and structured Risk Management can outperform static, one-layer indicators
Give Pine Script users a battle-tested RM backbone they can reuse, remix, and extend
If you are looking to automate your TradingView strategies, route signals to exchanges, or simply want safer, smarter strategy structures, please keep Signal Lynx in your search.
License: Mozilla Public License 2.0 (Open Source).
If you make beneficial modifications, please consider releasing them back to the community so everyone can benefit.

Blue Dot Pullback with Bollinger BonusKey FeaturesCore Blue Dot Condition:ATH Pulse: Checks if the highest high in the lookback period (default: 60 bars) is within 1% of the all-time high (over 5000 bars), using recentHigh >= allTimeHigh * 0.99.
Pullback: Price must be below the recent high (close < recentHigh ) but above a 10-period SMA (close > sma10) to ensure a bullish context.
Stochastic Crossover: Stochastic %K must cross above 20 (ta.crossover(k, stochOverSold)).
When these conditions are met, a blue dot is plotted below the bar.
Purple Dot Condition (Bollinger Band Bonus):Includes all blue dot conditions plus the price being within 2% of the lower Bollinger Band (close <= lowerBB * bbProximity).
When met, a purple dot is plotted instead of a blue dot to highlight the stronger signal.
Plotting Logic:Blue dots are plotted only when blueDotCondition is true and purpleDotCondition is false to avoid overlap.
Purple dots are plotted when purpleDotCondition is true (includes Bollinger Band proximity).
Alerts:Added separate alertcondition calls for blue and purple dots, allowing you to set up notifications in TradingView for each signal type.
Visualization:Stochastic %K and %D are plotted in a separate pane for reference, along with the oversold line (20).
You can disable the Stochastic plot by setting display=display.none in the plot functions.
Why This Should WorkCore Setup Alignment: The blue dot condition focuses on the core requirements (ATH, pullback, Stochastic crossover), which should produce signals similar to or more frequently than the ChatGPT script, as it omits the Bollinger Band requirement unless the purple dot condition is met.
Bollinger Band Bonus: The purple dot incorporates the Bollinger Band proximity check (bbNear), matching the ChatGPT script’s additional filter, ensuring purple dots appear when the price is near the lower Bollinger Band.
Flexible ATH Detection: Using recentHigh >= allTimeHigh * 0.99 makes the ATH condition less strict, increasing the likelihood of signals compared to my original script.
How to UseAdd to TradingView:Open the Pine Editor in TradingView.
Copy and paste the script.
Click "Add to Chart" to apply it.
Interpret Dots:Blue Dot: Indicates a stock near an ATH, in a pullback (above 10-period SMA), with a Stochastic crossover above 20. This is the core Dr. Wish setup.
Purple Dot: Same as blue dot but with the price also within 2% of the lower Bollinger Band, suggesting a stronger pullback signal.
Test and Compare:Apply the script to the same stock and timeframe where the ChatGPT script showed blue dots (e.g., NVDA or TSLA on a daily chart).
Check if blue dots appear at similar points and if purple dots appear when the price is near the lower Bollinger Band.
Adjust lookbackATH (e.g., 60 to 100) or bbProximity (e.g., 1.02 to 1.05) if signals are too rare or frequent.
Set Alerts:Use TradingView’s alert feature to create notifications for “Blue Dot Alert” or “Purple Dot Alert” when signals occur.
TroubleshootingIf you’re still not seeing blue or purple dots:Check the Chart: Ensure the stock has recently hit an ATH and pulled back. Test on volatile stocks like NVDA, TSLA, or AAPL on daily or weekly timeframes.
Timeframe Sensitivity: The script may produce fewer signals on lower timeframes (e.g., 1-hour) due to fewer ATH occurrences. Try a daily or weekly chart.
Parameter Tuning: Increase bbProximity (e.g., to 1.05) to allow purple dots for prices slightly further from the lower Bollinger Band, or increase lookbackATH to capture more ATHs.
Compare with ChatGPT Script: Run both scripts on the same chart to identify where signals differ. Share the ticker, timeframe, or a screenshot if you need help debugging specific cases.
Additional NotesThe 10-period SMA in the pullback condition (isPullback) is a simple bullish context filter. You can replace it with another condition (e.g., 20-period SMA or trend filter) if preferred.
The Bollinger Band parameters (bbLength=20, bbMult=2.0) are standard but can be adjusted to match your trading style.
The script uses a 5000-bar lookback for allTimeHigh to approximate a true ATH. If your chart has limited historical data, reduce this value (e.g., to 1000).

A_Traders_Edge__LibraryLibrary "A_Traders_Edge__Library"
- A Trader's Edge (ATE)_Library was created to assist in constructing Market Overview Scanners (MOS)
LabelLocation(_firstLocation)
This function is used when there's a desire to print an assets ALERT LABELS at a set location on the scale that will
NOT change throughout the progression of the script. This is created so that if a lot of alerts are triggered, they
will stay relatively visible and not overlap each other. Ex. If you set your '_firstLocation' parameter as 1, since
there are a max of 40 assets that can be scanned, the 1st asset's location is assigned the value in the '_firstLocation' parameter,
the 2nd asset's location is the (1st asset's location+1)...and so on. If your first location is set to 81 then
the 1st asset is 81 and 2nd is 82 and so on until the 40th location = 120(in this particular example).
Parameters:
_firstLocation (simple int) : (simple int)
Optional(starts at 1 if no parameter added).
Location that you want the first asset to print its label if is triggered to do so.
ie. loc2=loc1+1, loc3=loc2+1, etc.
Returns: Returns 40 output variables each being a different location to print the labels so that an asset is asssigned to
a particular location on the scale. Regardless of if you have the maximum amount of assets being screened (40 max), this
function will output 40 locations… So there needs to be 40 variables assigned in the tuple in this function. What I
mean by that is you need to have 40 output location variables within your tuple (ie. between the ' ') regarless of
if your scanning 40 assets or not. If you only have 20 assets in your scripts input settings, then only the first 20
variables within the ' ' Will be assigned to a value location and the other 20 will be assigned 'NA', but their
variables still need to be present in the tuple.
SeparateTickerids(_string)
You must form this single tickerID input string exactly as described in the scripts info panel (little gray 'i' that
is circled at the end of the settings in the settings/input panel that you can hover your cursor over this 'i' to read the
details of that particular input). IF the string is formed correctly then it will break up this single string parameter into
a total of 40 separate strings which will be all of the tickerIDs that the script is using in your MO scanner.
Parameters:
_string (simple string) : (string)
A maximum of 40 Tickers (ALL joined as 1 string for the input parameter) that is formulated EXACTLY as described
within the tooltips of the TickerID inputs in my MOS Scanner scripts:
assets = input.text_area(tIDset1, title="TickerID (MUST READ TOOLTIP)", tooltip="Accepts 40 TICKERID's for each
copy of the script on the chart. TEXT FORMATTING RULES FOR TICKERID'S:
(1) To exclude the EXCHANGE NAME in the Labels, de-select the next input option.
(2) MUST have a space (' ') AFTER each TickerID.
(3) Capitalization in the Labels will match cap of these TickerID's.
(4) If your asset has a BaseCurrency & QuoteCurrency (ie. ADAUSDT ) BUT you ONLY want Labels
to show BaseCurrency(ie.'ADA'), include a FORWARD SLASH ('/') between the Base & Quote (ie.'ADA/USDT')", display=display.none)
Returns: Returns 40 output variables of the different strings of TickerID's (ie. you need to output 40 variables within the
tuple ' ' regardless of if you were scanning using all possible (40) assets or not.
If your scanning for less than 40 assets, then once the variables are assigned to all of the tickerIDs, the rest
of the 40 variables in the tuple will be assigned "NA".
TickeridForLabelsAndSecurity(_includeExchange, _ticker)
This function accepts the TickerID Name as its parameter and produces a single string that will be used in all of your labels.
Parameters:
_includeExchange (simple bool) : (bool)
Optional(if parameter not included in function it defaults to false ).
Used to determine if the Exchange name will be included in all labels/triggers/alerts.
_ticker (simple string) : (string)
For this parameter, input the varible named '_coin' from your 'f_main()' function for this parameter. It is the raw
Ticker ID name that will be processed.
Returns: ( )
Returns 2 output variables:
1st ('_securityTickerid') is to be used in the 'request.security()' function as this string will contain everything
TV needs to pull the correct assets data.
2nd ('lblTicker') is to be used in all of the labels in your MOS as it will only contain what you want your labels
to show as determined by how the tickerID is formulated in the MOS's input.
InvalidTID(_tablePosition, _stackVertical, _close, _securityTickerid, _invalidArray)
This is to add a table in the middle right of your chart that prints all the TickerID's that were either not formulated
correctly in the '_source' input or that is not a valid symbol and should be changed.
Parameters:
_tablePosition (simple string) : (string)
Optional(if parameter not included, it defaults to position.middle_right). Location on the chart you want the table printed.
Possible strings include: position.top_center, position.top_left, position.top_right, position.middle_center,
position.middle_left, position.middle_right, position.bottom_center, position.bottom_left, position.bottom_right.
_stackVertical (simple bool) : (bool)
Optional(if parameter not included, it defaults to true). All of the assets that are counted as INVALID will be
created in a list. If you want this list to be prited as a column then input 'true' here.
_close (float) : (float)
If you want them printed as a single row then input 'false' here.
This should be the closing value of each of the assets being tested to determine in the TickerID is valid or not.
_securityTickerid (string) : (string)
Throughout the entire charts updates, if a '_close' value is never regestered then the logic counts the asset as INVALID.
This will be the 1st TickerID varible (named _securityTickerid) outputted from the tuple of the TickeridForLabels()
function above this one.
_invalidArray (string ) : (array string)
Input the array from the original script that houses all of the invalidArray strings.
Returns: (na)
Returns a table with the screened assets Invalid TickerID's. Table draws automatically if any are Invalid, thus,
no output variable to deal with.
LabelSizes(_barCnt, _lblSzRfrnce)
This function sizes your Alert Trigger Labels according to the amount of Printed Bars the chart has printed within
a set time period, while also keeping in mind the smallest relative reference size you input in the 'lblSzRfrnceInput'
parameter of this function. A HIGHER % of Printed Bars(aka...more trades occurring for that asset on the exchange),
the LARGER the Name Label will print, potentially showing you the better opportunities on the exchange to avoid
exchange manipulation liquidations.
*** SHOULD NOT be used as size of labels that are your asset Name Labels next to each asset's Line Plot...
if your MOS includes these as you want these to be the same size for every asset so the larger ones dont cover the
smaller ones if the plots are all close to each other ***
Parameters:
_barCnt (float) : (float)
Get the 1st variable('barCnt') from the 'PrintedBarCount' function's tuple and input it as this functions 1st input
parameter which will directly affect the size of the 2nd output variable ('alertTrigLabel') outputted by this function.
_lblSzRfrnce (string) : (string)
Optional(if parameter not included, it defaults to size.small). This will be the size of the 1st variable outputted
by this function ('assetNameLabel') BUT also affects the 2nd variable outputted by this function.
Returns: ( )
Returns 2 variables:
1st output variable ('AssetNameLabel') is assigned to the size of the 'lblSzRfrnceInput' parameter.
2nd output variable('alertTrigLabel') can be of variying sizes depending on the 'barCnt' parameter...BUT the smallest
size possible for the 2nd output variable ('alertTrigLabel') will be the size set in the 'lblSzRfrnceInput' parameter.
AssetColor()
This function is used to assign 40 different colors to 40 variables to be used for the different labels/plots.
Returns: Returns 40 output variables each with a different color assigned to them to be used in your plots & labels.
Regardless of if you have the maximum amount of assets your scanning(40 max) or less,
this function will assign 40 colors to 40 variables that you have between the ' '.
PrintedBarCount(_time, _barCntLength, _barCntPercentMin)
The Printed BarCount Filter looks back a User Defined amount of minutes and calculates the % of bars that have printed
out of the TOTAL amount of bars that COULD HAVE been printed within the same amount of time.
Parameters:
_time (int) : (int)
The time associated with the chart of the particular asset that is being screened at that point.
_barCntLength (int) : (int)
The amount of time (IN MINUTES) that you want the logic to look back at to calculate the % of bars that have actually
printed in the span of time you input into this parameter.
_barCntPercentMin (int) : (int)
The minimum % of Printed Bars of the asset being screened has to be GREATER than the value set in this parameter
for the output variable 'bc_gtg' to be true.
Returns: ( )
Returns 2 outputs:
1st is the % of Printed Bars that have printed within the within the span of time you input in the '_barCntLength' parameter.
2nd is true/false according to if the Printed BarCount % is above the threshold that you input into the '_barCntPercentMin' parameter.
RCI(_rciLength, _source, _interval)
You will see me using this a lot. DEFINITELY my favorite oscillator to utilize for SO many different things from
timing entries/exits to determining trends.Calculation of this indicator based on Spearmans Correlation.
Parameters:
_rciLength (int) : (int)
Amount of bars back to use in RCI calculations.
_source (float) : (float)
Source to use in RCI calculations (can use ANY source series. Ie, open,close,high,low,etc).
_interval (int) : (int)
Optional(if parameter not included, it defaults to 3). RCI calculation groups bars by this amount and then will.
rank these groups of bars.
Returns: (float)
Returns a single RCI value that will oscillates between -100 and +100.
RCIAVG(firstLength, _amtBtLengths, _rciSMAlen, _source, _interval)
20 RCI's are averaged together to get this RCI Avg (Rank Correlation Index Average). Each RCI (of the 20 total RCI)
has a progressively LARGER Lookback Length. Though the RCI Lengths are not individually adjustable,
there are 2 factors that ARE:
(1) the Lookback Length of the 1st RCI and
(2) the amount of values between one RCI's Lookback Length and the next.
*** If you set 'firstLength' to it's default of 200 and '_amtBtLengths' to it's default of 120 (aka AMOUNT BETWEEN LENGTHS=120)...
then RCI_2 Length=320, RCI_3 Length=440, RCI_4 Length=560, and so on.
Parameters:
firstLength (int) : (int)
Optional(if parameter is not included when the function is called, then it defaults to 200).
This parameter is the Lookback Length for the 1st RCI used in the RCI Avg.
_amtBtLengths (int) : (int)
Optional(if parameter not included when the function is called, then it defaults to 120).
This parameter is the value amount between each of the progressively larger lengths used for the 20 RCI's that
are averaged in the RCI Avg.
***** BEWARE ***** Too large of a value here will cause the calc to look back too far, causing an error(thus the value must be lowered)
_rciSMAlen (int) : (int)
Unlike the Single RCI Function, this function smooths out the end result using an SMA with a length value that is this parameter.
_source (float) : (float)
Source to use in RCI calculations (can use ANY source series. Ie, open,close,high,low,etc).
_interval (int) : (int)
Optional(if parameter not included, it defaults to 3). Within the RCI calculation, bars next to each other are grouped together
and then these groups are Ranked against each other. This parameter is the number of adjacent bars that are grouped together.
Returns: (float)
Returns a single RCI value that is the Avg of many RCI values that will oscillate between -100 and +100.
PercentChange(_startingValue, _endingValue)
This is a quick function to calculate how much % change has occurred between the '_startingValue' and the '_endingValue'
that you input into the function.
Parameters:
_startingValue (float) : (float)
The source value to START the % change calculation from.
_endingValue (float) : (float)
The source value to END the % change caluclation from.
Returns: Returns a single output being the % value between 0-100 (with trailing numbers behind a decimal). If you want only
a certain amount of numbers behind the decimal, this function needs to be put within a formatting function to do so.
Rescale(_source, _oldMin, _oldMax, _newMin, _newMax)
Rescales series with a known '_oldMin' & '_oldMax'. Use this when the scale of the '_source' to
rescale is known (bounded).
Parameters:
_source (float) : (float)
Source to be normalized.
_oldMin (int) : (float)
The known minimum of the '_source'.
_oldMax (int) : (float)
The known maximum of the '_source'.
_newMin (int) : (float)
What you want the NEW minimum of the '_source' to be.
_newMax (int) : (float)
What you want the NEW maximum of the '_source' to be.
Returns: Outputs your previously bounded '_source', but now the value will only move between the '_newMin' and '_newMax'
values you set in the variables.
Normalize_Historical(_source, _minimumLvl, _maximumLvl)
Normalizes '_source' that has a previously unknown min/max(unbounded) determining the max & min of the '_source'
FROM THE ENTIRE CHARTS HISTORY. ]
Parameters:
_source (float) : (float)
Source to be normalized.
_minimumLvl (int) : (float)
The Lower Boundary Level.
_maximumLvl (int) : (float)
The Upper Boundary Level.
Returns: Returns your same '_source', but now the value will MOSTLY stay between the minimum and maximum values you set in the
'_minimumLvl' and '_maximumLvl' variables (ie. if the source you input is an RSI...the output is the same RSI value but
instead of moving between 0-100 it will move between the maxand min you set).
Normailize_Local(_source, _length, _minimumLvl, _maximumLvl)
Normalizes series with previously unknown min/max(unbounded). Much like the Normalize_Historical function above this one,
but rather than using the Highest/Lowest Values within the ENTIRE charts history, this on looks for the Highest/Lowest
values of '_source' within the last ___ bars (set by user as/in the '_length' parameter. ]
Parameters:
_source (float) : (float)
Source to be normalized.
_length (int) : (float)
The amount of bars to look back to determine the highest/lowest '_source' value.
_minimumLvl (int) : (float)
The Lower Boundary Level.
_maximumLvl (int) : (float)
The Upper Boundary Level.
Returns: Returns a single output variable being the previously unbounded '_source' that is now normalized and bound between
the values used for '_minimumLvl'/'_maximumLvl' of the '_source' within the user defined lookback period.
PSESS1 - Learn PineScript InputsThis is a script written exclusively for people who are trying to learn Pine Script.
PSESS stands for "Pine Script Educational Script Series" which is a series of scripts that helps Pine Script programmers in 2 ways:
1. Learn Pine Script at more depth by an interactive environment where they can immediately see the effects of any change in the pre-written code and also comparing different lines code having tiny differences so they can grasp the details.
2. Have this script open while coding in order to copy the line they find useful
Pine Script Library couldn't be used for this purpose since this script has educational aspect and needs to be executable individually.
This is Script 1 of PSESS and focuses on inputs in Pine Script.
The script is densly commented in order to make it understandable. here is the outline of the script:
1. Inputs that can be received through the indicator() function
2. 12 possible types of input
3. Input() function arguments: defval - title - tooltip - inline - group - confirm
4. The different display of tooltip when inputs are inline
5. Multiple price and time inputs (on single request or multiple requests)
6. What happens when title argument is not specified
7. References and key points from them

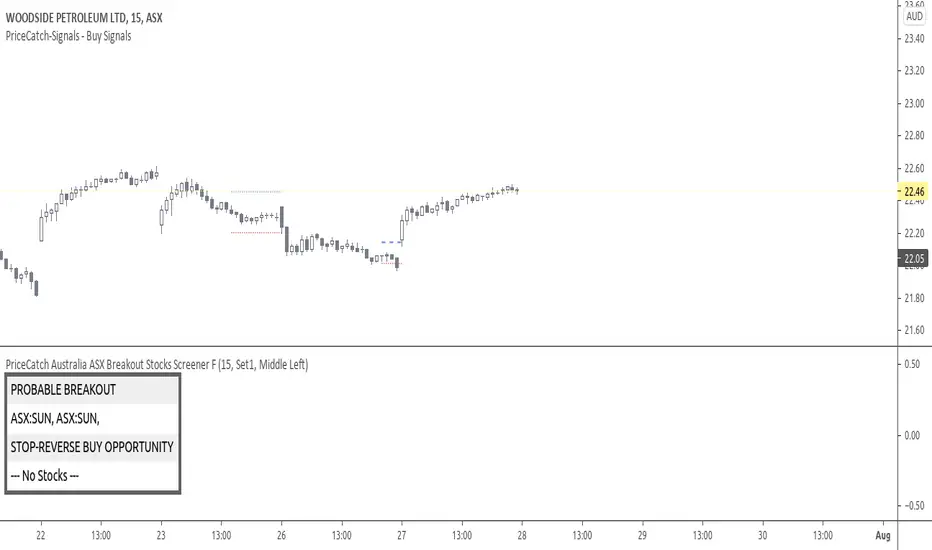
PriceCatch Australia ASX Breakout Stocks Screener FHi,
TradingView community and Australia (ASX) traders. Warm Greetings.
PriceCatch Australia (ASX) Breakout Stocks Screener
I am sharing a script that screens Australia (ASX) stocks for Probable Breakout Buy signal and Stop-Reverse Buy Signal. This script may prove to be useful to traders who trade Australia (ASX) listed stocks.
I have already shared the script "PriceCatch Signals Buy Signals" that marks the following levels on the chart.
Probable Breakout Buy Level
Stop-Reverse Buy Level
While the script "PriceCatch Signals Buy Signals" can be used independently, this script is intended to be used with the script "PriceCatch Signals Buy Signals".
Used together, these two scripts may help you identify probable breakout opportunities. This Screener will help you screen stocks that have broken out of any of the Breakout levels marked by the "PriceCatch Signals Buy Signals" script. This way you can quickly and automatically identify breakout stocks without manually going through every stock in your watchlist searching for breakout signals.
Please read the Notes of the script "PriceCatch Signals Buy Signals" for explanation of its functionality.
STOCKS SET
This Free screener scans a list of 20 stocks. The full version scans a list of 80 stocks. Care has been taken to include liquid stocks and stocks of AUD $10 and above only, to avoid penny stocks.
Chart resolution vs. Script resolution
It is suggested to set the chart resolution to a lower time-frame than the Screener resolution. For example, if the screener resolution is set to 1 Hour time-frame, set the chart resolution to less than 1 Hour time-frame and run the Screener.
CHART
The Screener runs independently and you may have any other ASX chart on your screen.
NOTE - PRIOR TO USING THIS SCRIPT:
Please remember that the script is shared with absolutely no assurances about usability and any warranties whatsoever and as a responsible trader, please satisfy yourselves thoroughly and use it only if you are satisfied it works for you. Remember, you are 100% responsible for your actions. If you understand and accept that, you may use the script.
QUERIES/FEEDBACK
Please PM me or comment.
Regards to all and wish everyone all the best with trading.
PriceCatch NASDAQ Breakout Stocks Screener FHi,
Tradingview community and NASDAQ traders. Warm Greetings.
NASDAQ Breakout Stocks Screener
I am sharing a script that screens NASDAQ stocks for Probable Breakout Buy signal and Stop-Reverse Buy Signal. This script may prove to be useful to traders who trade NASDAQ listed stocks.
I have already shared the script "PriceCatch Signals Buy Signals" that marks the following levels on the chart.
Probable Breakout Buy Level
Stop-Reverse Buy Level
While the script "PriceCatch Signals Buy Signals" can be used independently, this script is intended to be used with the script "PriceCatch Signals Buy Signals".
Used together, these two scripts may help you identify probable breakout opportunities. This Screener will help you screen stocks that have broken out of any of the Breakout levels marked by the "PriceCatch Signals Buy Signals" script. This way you can quickly and automatically identify breakout stocks without manually going through every stock in your watchlist searching for breakout signals.
Please read the Notes of the script "PriceCatch Signals Buy Signals" for explanation of its functionality.
STOCKS SET
This Free screener scans a list of 20 stocks. The full version scans a list of 160 stocks. Care has been taken to include liquid stocks with over 500K daily volume.
Chart resolution vs. Script resolution
It is suggested to set the chart resolution to a lower time-frame than the Screener resolution. For example, if the screener resolution is set to 1 Hour time-frame, set the chart resolution to less than 1 Hour time-frame and run the Screener.
CHART
The Screener runs independently and you may have any chart on your screen. As you can see chart is showing XLNX and the screener has identified a set of other stocks.
NOTE - PRIOR TO USING THIS SCRIPT:
Please remember that the script is shared with absolutely no assurances about usability and any warranties whatsoever and as a responsible trader, please satisfy yourselves thoroughly and use it only if you are satisfied it works for you. Remember, you are 100% responsible for your actions. If you understand and accept that, you may use the script.
QUERIES/FEEDBACK
Please PM me.
Regards to all and wish everyone all the best with trading.

`security()` revisited [PineCoders]NOTE
The non-repainting technique in this publication that relies on bar states is now deprecated, as we have identified inconsistencies that undermine its credibility as a universal solution. The outputs that use the technique are still available for reference in this publication. However, we do not endorse its usage. See this publication for more information about the current best practices for requesting HTF data and why they work.
█ OVERVIEW
This script presents a new function to help coders use security() in both repainting and non-repainting modes. We revisit this often misunderstood and misused function, and explain its behavior in different contexts, in the hope of dispelling some of the coder lure surrounding it. The function is incredibly powerful, yet misused, it can become a dangerous WMD and an instrument of deception, for both coders and traders.
We will discuss:
• How to use our new `f_security()` function.
• The behavior of Pine code and security() on the three very different types of bars that make up any chart.
• Why what you see on a chart is a simulation, and should be taken with a grain of salt.
• Why we are presenting a new version of a function handling security() calls.
• Other topics of interest to coders using higher timeframe (HTF) data.
█ WARNING
We have tried to deliver a function that is simple to use and will, in non-repainting mode, produce reliable results for both experienced and novice coders. If you are a novice coder, stick to our recommendations to avoid getting into trouble, and DO NOT change our `f_security()` function when using it. Use `false` as the function's last argument and refrain from using your script at smaller timeframes than the chart's. To call our function to fetch a non-repainting value of close from the 1D timeframe, use:
f_security(_sym, _res, _src, _rep) => security(_sym, _res, _src )
previousDayClose = f_security(syminfo.tickerid, "D", close, false)
If that's all you're interested in, you are done.
If you choose to ignore our recommendation and use the function in repainting mode by changing the `false` in there for `true`, we sincerely hope you read the rest of our ramblings before you do so, to understand the consequences of your choice.
Let's now have a look at what security() is showing you. There is a lot to cover, so buckle up! But before we dig in, one last thing.
What is a chart?
A chart is a graphic representation of events that occur in markets. As any representation, it is not reality, but rather a model of reality. As Scott Page eloquently states in The Model Thinker : "All models are wrong; many are useful". Having in mind that both chart bars and plots on our charts are imperfect and incomplete renderings of what actually occurred in realtime markets puts us coders in a place from where we can better understand the nature of, and the causes underlying the inevitable compromises necessary to build the data series our code uses, and print chart bars.
Traders or coders complaining that charts do not reflect reality act like someone who would complain that the word "dog" is not a real dog. Let's recognize that we are dealing with models here, and try to understand them the best we can. Sure, models can be improved; TradingView is constantly improving the quality of the information displayed on charts, but charts nevertheless remain mere translations. Plots of data fetched through security() being modelized renderings of what occurs at higher timeframes, coders will build more useful and reliable tools for both themselves and traders if they endeavor to perfect their understanding of the abstractions they are working with. We hope this publication helps you in this pursuit.
█ FEATURES
This script's "Inputs" tab has four settings:
• Repaint : Determines whether the functions will use their repainting or non-repainting mode.
Note that the setting will not affect the behavior of the yellow plot, as it always repaints.
• Source : The source fetched by the security() calls.
• Timeframe : The timeframe used for the security() calls. If it is lower than the chart's timeframe, a warning appears.
• Show timeframe reminder : Displays a reminder of the timeframe after the last bar.
█ THE CHART
The chart shows two different pieces of information and we want to discuss other topics in this section, so we will be covering:
A — The type of chart bars we are looking at, indicated by the colored band at the top.
B — The plots resulting of calling security() with the close price in different ways.
C — Points of interest on the chart.
A — Chart bars
The colored band at the top shows the three types of bars that any chart on a live market will print. It is critical for coders to understand the important distinctions between each type of bar:
1 — Gray : Historical bars, which are bars that were already closed when the script was run on them.
2 — Red : Elapsed realtime bars, i.e., realtime bars that have run their course and closed.
The state of script calculations showing on those bars is that of the last time they were made, when the realtime bar closed.
3 — Green : The realtime bar. Only the rightmost bar on the chart can be the realtime bar at any given time, and only when the chart's market is active.
Refer to the Pine User Manual's Execution model page for a more detailed explanation of these types of bars.
B — Plots
The chart shows the result of letting our 5sec chart run for a few minutes with the following settings: "Repaint" = "On" (the default is "Off"), "Source" = `close` and "Timeframe" = 1min. The five lines plotted are the following. They have progressively thinner widths:
1 — Yellow : A normal, repainting security() call.
2 — Silver : Our recommended security() function.
3 — Fuchsia : Our recommended way of achieving the same result as our security() function, for cases when the source used is a function returning a tuple.
4 — White : The method we previously recommended in our MTF Selection Framework , which uses two distinct security() calls.
5 — Black : A lame attempt at fooling traders that MUST be avoided.
All lines except the first one in yellow will vary depending on the "Repaint" setting in the script's inputs. The first plot does not change because, contrary to all other plots, it contains no conditional code to adapt to repainting/no-repainting modes; it is a simple security() call showing its default behavior.
C — Points of interest on the chart
Historical bars do not show actual repainting behavior
To appreciate what a repainting security() call will plot in realtime, one must look at the realtime bar and at elapsed realtime bars, the bars where the top line is green or red on the chart at the top of this page. There you can see how the plots go up and down, following the close value of each successive chart bar making up a single bar of the higher timeframe. You would see the same behavior in "Replay" mode. In the realtime bar, the movement of repainting plots will vary with the source you are fetching: open will not move after a new timeframe opens, low and high will change when a new low or high are found, close will follow the last feed update. If you are fetching a value calculated by a function, it may also change on each update.
Now notice how different the plots are on historical bars. There, the plot shows the close of the previously completed timeframe for the whole duration of the current timeframe, until on its last bar the price updates to the current timeframe's close when it is confirmed (if the timeframe's last bar is missing, the plot will only update on the next timeframe's first bar). That last bar is the only one showing where the plot would end if that timeframe's bars had elapsed in realtime. If one doesn't understand this, one cannot properly visualize how his script will calculate in realtime when using repainting. Additionally, as published scripts typically show charts where the script has only run on historical bars, they are, in fact, misleading traders who will naturally assume the script will behave the same way on realtime bars.
Non-repainting plots are more accurate on historical bars
Now consider this chart, where we are using the same settings as on the chart used to publish this script, except that we have turned "Repainting" off this time:
The yellow line here is our reference, repainting line, so although repainting is turned off, it is still repainting, as expected. Because repainting is now off, however, plots on historical bars show the previous timeframe's close until the first bar of a new timeframe, at which point the plot updates. This correctly reflects the behavior of the script in the realtime bar, where because we are offsetting the series by one, we are always showing the previously calculated—and thus confirmed—higher timeframe value. This means that in realtime, we will only get the previous timeframe's values one bar after the timeframe's last bar has elapsed, at the open of the first bar of a new timeframe. Historical and elapsed realtime bars will not actually show this nuance because they reflect the state of calculations made on their close , but we can see the plot update on that bar nonetheless.
► This more accurate representation on historical bars of what will happen in the realtime bar is one of the two key reasons why using non-repainting data is preferable.
The other is that in realtime, your script will be using more reliable data and behave more consistently.
Misleading plots
Valiant attempts by coders to show non-repainting, higher timeframe data updating earlier than on our chart are futile. If updates occur one bar earlier because coders use the repainting version of the function, then so be it, but they must then also accept that their historical bars are not displaying information that is as accurate. Not informing script users of this is to mislead them. Coders should also be aware that if they choose to use repainting data in realtime, they are sacrificing reliability to speed and may be running a strategy that behaves very differently from the one they backtested, thus invalidating their tests.
When, however, coders make what are supposed to be non-repainting plots plot artificially early on historical bars, as in examples "c4" and "c5" of our script, they would want us to believe they have achieved the miracle of time travel. Our understanding of the current state of science dictates that for now, this is impossible. Using such techniques in scripts is plainly misleading, and public scripts using them will be moderated. We are coding trading tools here—not video games. Elementary ethics prescribe that we should not mislead traders, even if it means not being able to show sexy plots. As the great Feynman said: You should not fool the layman when you're talking as a scientist.
You can readily appreciate the fantasy plot of "c4", the thinnest line in black, by comparing its supposedly non-repainting behavior between historical bars and realtime bars. After updating—by miracle—as early as the wide yellow line that is repainting, it suddenly moves in a more realistic place when the script is running in realtime, in synch with our non-repainting lines. The "c5" version does not plot on the chart, but it displays in the Data Window. It is even worse than "c4" in that it also updates magically early on historical bars, but goes on to evaluate like the repainting yellow line in realtime, except one bar late.
Data Window
The Data Window shows the values of the chart's plots, then the values of both the inside and outside offsets used in our calculations, so you can see them change bar by bar. Notice their differences between historical and elapsed realtime bars, and the realtime bar itself. If you do not know about the Data Window, have a look at this essential tool for Pine coders in the Pine User Manual's page on Debugging . The conditional expressions used to calculate the offsets may seem tortuous but their objective is quite simple. When repainting is on, we use this form, so with no offset on all bars:
security(ticker, i_timeframe, i_source )
// which is equivalent to:
security(ticker, i_timeframe, i_source)
When repainting is off, we use two different and inverted offsets on historical bars and the realtime bar:
// Historical bars:
security(ticker, i_timeframe, i_source )
// Realtime bar (and thus, elapsed realtime bars):
security(ticker, i_timeframe, i_source )
The offsets in the first line show how we prevent repainting on historical bars without the need for the `lookahead` parameter. We use the value of the function call on the chart's previous bar. Since values between the repainting and non-repainting versions only differ on the timeframe's last bar, we can use the previous value so that the update only occurs on the timeframe's first bar, as it will in realtime when not repainting.
In the realtime bar, we use the second call, where the offsets are inverted. This is because if we used the first call in realtime, we would be fetching the value of the repainting function on the previous bar, so the close of the last bar. What we want, instead, is the data from the previous, higher timeframe bar , which has elapsed and is confirmed, and thus will not change throughout realtime bars, except on the first constituent chart bar belonging to a new higher timeframe.
After the offsets, the Data Window shows values for the `barstate.*` variables we use in our calculations.
█ NOTES
Why are we revisiting security() ?
For four reasons:
1 — We were seeing coders misuse our `f_secureSecurity()` function presented in How to avoid repainting when using security() .
Some novice coders were modifying the offset used with the history-referencing operator in the function, making it zero instead of one,
which to our horror, caused look-ahead bias when used with `lookahead = barmerge.lookahead_on`.
We wanted to present a safer function which avoids introducing the dreaded "lookahead" in the scripts of unsuspecting coders.
2 — The popularity of security() in screener-type scripts where coders need to use the full 40 calls allowed per script made us want to propose
a solid method of allowing coders to offer a repainting/no-repainting choice to their script users with only one security() call.
3 — We wanted to explain why some alternatives we see circulating are inadequate and produce misleading behavior.
4 — Our previous publication on security() focused on how to avoid repainting, yet many other considerations worthy of attention are not related to repainting.
Handling tuples
When sending function calls that return tuples with security() , our `f_security()` function will not work because Pine does not allow us to use the history-referencing operator with tuple return values. The solution is to integrate the inside offset to your function's arguments, use it to offset the results the function is returning, and then add the outside offset in a reassignment of the tuple variables, after security() returns its values to the script, as we do in our "c2" example.
Does it repaint?
We're pretty sure Wilder was not asked very often if RSI repainted. Why? Because it wasn't in fashion—and largely unnecessary—to ask that sort of question in the 80's. Many traders back then used daily charts only, and indicator values were calculated at the day's close, so everybody knew what they were getting. Additionally, indicator values were calculated by generally reputable outfits or traders themselves, so data was pretty reliable. Today, almost anybody can write a simple indicator, and the programming languages used to write them are complex enough for some coders lacking the caution, know-how or ethics of the best professional coders, to get in over their heads and produce code that does not work the way they think it does.
As we hope to have clearly demonstrated, traders do have legitimate cause to ask if MTF scripts repaint or not when authors do not specify it in their script's description.
► We recommend that authors always use our `f_security()` with `false` as the last argument to avoid repainting when fetching data dependent on OHLCV information. This is the only way to obtain reliable HTF data. If you want to offer users a choice, make non-repainting mode the default, so that if users choose repainting, it will be their responsibility. Non-repainting security() calls are also the only way for scripts to show historical behavior that matches the script's realtime behavior, so you are not misleading traders. Additionally, non-repainting HTF data is the only way that non-repainting alerts can be configured on MTF scripts, as users of MTF scripts cannot prevent their alerts from repainting by simply configuring them to trigger on the bar's close.
Data feeds
A chart at one timeframe is made up of multiple feeds that mesh seamlessly to form one chart. Historical bars can use one feed, and the realtime bar another, which brokers/exchanges can sometimes update retroactively so that elapsed realtime bars will reappear with very slight modifications when the browser's tab is refreshed. Intraday and daily chart prices also very often originate from different feeds supplied by brokers/exchanges. That is why security() calls at higher timeframes may be using a completely different feed than the chart, and explains why the daily high value, for example, can vary between timeframes. Volume information can also vary considerably between intraday and daily feeds in markets like stocks, because more volume information becomes available at the end of day. It is thus expected behavior—and not a bug—to see data variations between timeframes.
Another point to keep in mind concerning feeds it that when you are using a repainting security() plot in realtime, you will sometimes see discrepancies between its plot and the realtime bars. An artefact revealing these inconsistencies can be seen when security() plots sometimes skip a realtime chart bar during periods of high market activity. This occurs because of races between the chart and the security() feeds, which are being monitored by independent, concurrent processes. A blue arrow on the chart indicates such an occurrence. This is another cause of repainting, where realtime bar-building logic can produce different outcomes on one closing price. It is also another argument supporting our recommendation to use non-repainting data.
Alternatives
There is an alternative to using security() in some conditions. If all you need are OHLC prices of a higher timeframe, you can use a technique like the one Duyck demonstrates in his security free MTF example - JD script. It has the great advantage of displaying actual repainting values on historical bars, which mimic the code's behavior in the realtime bar—or at least on elapsed realtime bars, contrary to a repainting security() plot. It has the disadvantage of using the current chart's TF data feed prices, whereas higher timeframe data feeds may contain different and more reliable prices when they are compiled at the end of the day. In its current state, it also does not allow for a repainting/no-repainting choice.
When `lookahead` is useful
When retrieving non-price data, or in special cases, for experiments, it can be useful to use `lookahead`. One example is our Backtesting on Non-Standard Charts: Caution! script where we are fetching prices of standard chart bars from non-standard charts.
Warning users
Normal use of security() dictates that it only be used at timeframes equal to or higher than the chart's. To prevent users from inadvertently using your script in contexts where it will not produce expected behavior, it is good practice to warn them when their chart is on a higher timeframe than the one in the script's "Timeframe" field. Our `f_tfReminderAndErrorCheck()` function in this script does that. It can also print a reminder of the higher timeframe. It uses one security() call.
Intrabar timeframes
security() is not supported by TradingView when used with timeframes lower than the chart's. While it is still possible to use security() at intrabar timeframes, it then behaves differently. If no care is taken to send a function specifically written to handle the successive intrabars, security() will return the value of the last intrabar in the chart's timeframe, so the last 1H bar in the current 1D bar, if called at "60" from a "D" chart timeframe. If you are an advanced coder, see our FAQ entry on the techniques involved in processing intrabar timeframes. Using intrabar timeframes comes with important limitations, which you must understand and explain to traders if you choose to make scripts using the technique available to others. Special care should also be taken to thoroughly test this type of script. Novice coders should refrain from getting involved in this.
█ TERMINOLOGY
Timeframe
Timeframe , interval and resolution are all being used to name the concept of timeframe. We have, in the past, used "timeframe" and "resolution" more or less interchangeably. Recently, members from the Pine and PineCoders team have decided to settle on "timeframe", so from hereon we will be sticking to that term.
Multi-timeframe (MTF)
Some coders use "multi-timeframe" or "MTF" to name what are in fact "multi-period" calculations, as when they use MAs of progressively longer periods. We consider that a misleading use of "multi-timeframe", which should be reserved for code using calculations actually made from another timeframe's context and using security() , safe for scripts like Duyck's one mentioned earlier, or TradingView's Relative Volume at Time , which use a user-selected timeframe as an anchor to reset calculations. Calculations made at the chart's timeframe by varying the period of MAs or other rolling window calculations should be called "multi-period", and "MTF-anchored" could be used for scripts that reset calculations on timeframe boundaries.
Colophon
Our script was written using the PineCoders Coding Conventions for Pine .
The description was formatted using the techniques explained in the How We Write and Format Script Descriptions PineCoders publication.
Snippets were lifted from our MTF Selection Framework , then massaged to create the `f_tfReminderAndErrorCheck()` function.
█ THANKS
Thanks to apozdnyakov for his help with the innards of security() .
Thanks to bmistiaen for proofreading our description.
Look first. Then leap.

Smart Divergence Engine [ChartNation]SMART DIVERGENCE ENGINE — REPAINTING-PROOF RSI DIVERGENCE WITH EXHAUSTION CONFIRMATION
═══════════════════════════════════════════
Smart Divergence Engine solves three critical problems that plague free RSI divergence indicators:
PROBLEM 1: REPAINTING DIVERGENCES
Most divergence scripts detect divergence in real-time as bars form. This causes signals to appear, disappear, and reappear unpredictably—making them unusable for alerts or systematic trading.
OUR SOLUTION: Pivot-Locked Detection
Smart Divergence Engine evaluates RSI at the exact bar where price structure confirms (rsi ), not at the current bar. Once a divergence prints, it NEVER disappears. This is implemented via:
Full swing confirmation (Pivot Left + Pivot Right bars must complete)
RSI evaluation at historical bar: rsi , not rsi
Divergence triggers AFTER structure lock, not during formation
Technical implementation: The script stores RSI values at confirmed pivot bars using var floats (lowRsiPrev, lowRsiCurr, highRsiPrev, highRsiCurr), then compares these locked values when new pivots confirm. This prevents any possibility of historical repaint.
PROBLEM 2: FALSE POSITIVE OVERLOAD
Divergence scripts trigger on ANY price-RSI mismatch, flooding charts with weak signals during choppy conditions. No filtering means traders must manually screen out noise.
OUR SOLUTION: Shark Fin Exhaustion Filter
Before any divergence can be considered actionable, Smart Divergence Engine requires RSI to demonstrate genuine momentum exhaustion through our proprietary "Shark Fin" detection:
Shark Fin Logic (Not Found in Free Scripts):
RSI must pierce the outer volatility band by a configurable buffer (default 1.5 RSI points)
RSI must re-enter the band with directional confirmation (positive slope for bullish, negative slope for bearish)
Band width must exceed minimum standard deviation threshold (volatility qualification)
Cooldown period enforced (default 25 bars) to prevent signal clustering
This multi-condition filter dramatically reduces false divergences by requiring RSI to physically demonstrate exhaustion BEFORE structure confirmation matters.
Technical implementation: The Shark Fin state machine uses boolean flags (bullFinForming, bearFinForming) to track when RSI is stretched beyond bands, then validates re-entry using ta.crossover(rsi, lower) / ta.crossunder(rsi, upper) with slope checks (ta.change(rsi) > 0 / < 0) and volatility gates (dev >= finMinDev).
PROBLEM 3: NO VOLATILITY CONTEXT
Divergence scripts use fixed RSI levels (30/70 or similar) that fail to adapt to changing market conditions. What's "overbought" in a low-volatility regime differs drastically from high-volatility conditions.
OUR SOLUTION: Adaptive Volatility Bands
Smart Divergence Engine calculates dynamic overbought/oversold zones using:
34-period SMA of RSI as basis
1.618 standard deviation multiplier (golden ratio expansion)
Real-time band expansion/contraction based on RSI volatility
The bands provide three advantages:
Shark Fin events only qualify when RSI breaches ADAPTIVE thresholds, not arbitrary fixed levels
Band width (standard deviation) serves as volatility filter—narrow bands = low conviction moves get rejected
50-line midline provides regime context (above 50 = bullish bias, below 50 = bearish bias)
Technical implementation: basis = ta.sma(rsi, 34), dev = ta.stdev(rsi, 34), upper/lower = basis ± dev * 1.618. Shark Fin logic requires rsi < (lower - finBuffer) or rsi > (upper + finBuffer) to trigger, ensuring exhaustion is measured relative to CURRENT volatility, not historical constants.
═══════════════════════════════════════════
METHODOLOGY COMPARISON VS FREE ALTERNATIVES
═══════════════════════════════════════════
STANDARD DIVERGENCE SCRIPTS:
Detection timing: Real-time (current bar)
Historical stability: Repaints continuously
Signal filtering: None or minimal
Volatility adaptation: Fixed levels (30/70)
Exhaustion confirmation: Not implemented
Confirmation layers: 1 (divergence only)
Alert reliability: Unreliable (signals disappear)
SMART DIVERGENCE ENGINE:
Detection timing: Pivot-confirmed (rsi )
Historical stability: Locked at structure bar
Signal filtering: Shark Fin + cooldown + stdev gate
Volatility adaptation: Dynamic bands (34-SMA + 1.618σ)
Exhaustion confirmation: Required via Shark Fin
Confirmation layers: 3 (structure + exhaustion + volatility)
Alert reliability: Stable (never repaints)
═══════════════════════════════════════════
TECHNICAL SPECIFICATIONS
═══════════════════════════════════════════
RSI ENGINE:
Base calculation: ta.rsi(src, 14)
Smoothing: ta.rma(rsiRaw, 2) — reduces whipsaw noise
Source: Configurable (default close)
VOLATILITY BANDS:
Basis: 34-period SMA of RSI
Multiplier: 1.618 (golden ratio)
Upper band: basis + (stdev * 1.618)
Lower band: basis - (stdev * 1.618)
Purpose: Creates adaptive overbought/oversold zones
DIVERGENCE DETECTION:
Pivot confirmation: 10 left bars + 10 right bars (default)
RSI evaluation: Locked at rsi (historical bar, never current)
Bullish divergence: price lower low + RSI higher low
Bearish divergence: price higher high + RSI lower high
Rendering: Lines drawn between last two confirmed pivots with labels
SHARK FIN EXHAUSTION FILTER:
Depth buffer: 1.5 RSI points (penetration threshold beyond band)
Min band stdev: 1.0 (volatility qualification)
Cooldown: 25 bars minimum between Shark Fin confirmations
Slope validation: Requires ta.change(rsi) > 0 (bullish) or < 0 (bearish)
State tracking: Boolean flags prevent premature confirmations
VISUAL CUSTOMIZATION:
Beauty Mode: Six-layer gradient fill anchored at 50-line
• Purple regime (above 50) with configurable opacity
• Green regime (below 50) with configurable opacity
• Gradient layers: 33%, 66%, 100% intensity
Divergence lines: Glow effect (6px) + core line (3px), both configurable
Shark Fin rendering: 20% fill between RSI and violated band (ephemeral)
Labels: Compact "Bull"/"Bear" markers with dot indicators
═══════════════════════════════════════════
ALERT SYSTEM
═══════════════════════════════════════════
Four distinct alert conditions (configure once, fires on all intervals):
"RSI Shark Fin — Bullish"
Triggers when: RSI re-enters lower band from below with slope + stdev + cooldown confirmation
Use case: Momentum exhaustion at oversold extreme
Reliability: No repaint (confirmation locked at re-entry bar)
"RSI Shark Fin — Bearish"
Triggers when: RSI re-enters upper band from above with slope + stdev + cooldown confirmation
Use case: Momentum exhaustion at overbought extreme
Reliability: No repaint (confirmation locked at re-entry bar)
"Bullish Divergence (Panel)"
Triggers when: Pivot-confirmed bullish divergence completes (price LL + RSI HL)
Timing: Fires AFTER Pivot Right bars complete (delayed but stable)
Reliability: Never repaints (divergence locked at rsi )
"Bearish Divergence (Panel)"
Triggers when: Pivot-confirmed bearish divergence completes (price HH + RSI LH)
Timing: Fires AFTER Pivot Right bars complete (delayed but stable)
Reliability: Never repaints (divergence locked at rsi )
═══════════════════════════════════════════
TRADING IMPLEMENTATION
═══════════════════════════════════════════
CONFLUENCE FRAMEWORK:
Highest-probability setups occur when three conditions align:
Bullish Setup:
Shark Fin confirms below lower band (exhaustion)
Bullish divergence prints at pivot (structure)
RSI reclaims 50 line (regime shift to bullish)
→ Entry consideration at next price structure (support, swing low)
Bearish Setup:
Shark Fin confirms above upper band (exhaustion)
Bearish divergence prints at pivot (structure)
RSI loses 50 line (regime shift to bearish)
→ Entry consideration at next price structure (resistance, swing high)
TREND CONTEXT:
Strong uptrends: Prioritize bullish divergence + lower band Shark Fins (buy dips)
Strong downtrends: Prioritize bearish divergence + upper band Shark Fins (sell rallies)
Range-bound markets: Use 50-line crossovers as additional confirmation filter
RISK MANAGEMENT:
Smart Divergence Engine provides CONTEXT, not entries:
Wait for price confirmation (engulfing candle, rejection wick, structure break)
Place stops below/above pivot structure that triggered divergence
Size positions based on distance to invalidation level
Divergence + Shark Fin = elevated probability, not certainty
═══════════════════════════════════════════
CONFIGURATION PARAMETERS
═══════════════════════════════════════════
RSI SETTINGS:
RSI Length: 14 (default, standard momentum window)
Price Source: close (configurable to any price source)
Note: 2-period RMA smoothing is hardcoded (reduces noise)
VOLATILITY BAND SETTINGS:
Band Length: 34 (SMA period for RSI basis)
Band Multiplier: 1.618 (golden ratio, adjustable)
Show Bands: Toggle visibility (true/false)
DIVERGENCE SETTINGS:
Pivot Left: 10 bars (left-side swing confirmation)
Pivot Right: 10 bars (right-side swing confirmation)
Overbought Level: 68 (reference line, does not affect logic)
Oversold Level: 32 (reference line, does not affect logic)
SHARK FIN SETTINGS:
Fin Depth Buffer: 1.5 RSI points (penetration threshold)
Min Band Stdev: 1.0 (volatility qualification gate)
Min Bars Between Fins: 25 (cooldown period)
VISUAL SETTINGS (Beauty Mode):
Enable Beauty Mode: true/false (gradient rendering)
Divergence Glow: true/false (glow effect on lines)
Glow Width: 3-10 px (glow layer thickness)
Main Line Width: 1-6 px (divergence core line)
Top Color: Purple (configurable, above-50 regime)
Bottom Color: Green (configurable, below-50 regime)
Top Opacity: 0-100% (gradient base transparency)
Bottom Opacity: 0-100% (gradient base transparency)
═══════════════════════════════════════════
PERFORMANCE & LIMITATIONS
═══════════════════════════════════════════
RESOURCE ALLOCATION:
max_lines_count: 500 (divergence + Shark Fin lines)
max_labels_count: 500 (divergence markers)
max_bars_back: 500 (historical pivot lookback)
Suitable for most timeframes; reduce limits if performance degrades on low-end devices
SIGNAL TIMING:
Divergences print AFTER Pivot Right bars complete. This is intentional:
Delayed signals are more reliable than real-time signals
Structure confirmation requires waiting for swing completion
Users demanding instant signals should use free real-time divergence indicators
Users demanding reliable signals that never disappear should use this
PANEL VS OVERLAY:
This is the panel version (overlay=false):
Renders in separate pane below price chart
RSI, bands, divergence lines, and Shark Fin fills appear in this pane
For price-chart annotations, use the companion overlay version (same logic, different rendering)
═══════════════════════════════════════════
This script implements proprietary methodology not available in regular community scripts:
REPAINTING-PROOF ARCHITECTURE
The pivot-locked detection system (rsi evaluation) is a non-trivial implementation that requires:
State management across bars using var variables
Historical RSI value storage at pivot confirmation
Divergence comparison between stored values (not current bar)
This architecture eliminates the #1 complaint with free divergence indicators: disappearing signals.
SHARK FIN EXHAUSTION LOGIC
The multi-condition state machine that validates momentum exhaustion is not found in free scripts:
Penetration threshold (buffer beyond band)
Directional slope confirmation on re-entry
Volatility gate (minimum standard deviation)
Cooldown enforcement (prevents clustering)
This filter layer was developed through extensive backtesting to reduce false divergences during choppy conditions.
ADAPTIVE VOLATILITY FRAMEWORK
The dynamic band system (34-SMA + 1.618σ) provides context-aware overbought/oversold detection:
Bands expand in volatile markets → signals adapt to conditions
Bands contract in ranging markets → tighter detection thresholds
50-line regime framework → directional bias context
This approach outperforms fixed-level systems (30/70) that ignore market context.
CONFLUENCE METHODOLOGY
The three-layer confirmation system (structure + exhaustion + volatility) was engineered to answer: "When is a divergence actually tradeable?" Free scripts detect divergence and stop there. Smart Divergence Engine asks: "Did RSI show exhaustion? Is volatility sufficient? Did structure confirm?"
This level of methodological depth—combined with repainting-proof architecture and professional-grade visual implementation—justifies closed-source protection and paid access.
═══════════════════════════════════════════
Smart Divergence Engine is engineered for traders who demand institutional-grade divergence detection without the noise, repainting, and false positives that plague free alternatives.
Access is restricted to maintain signal quality as methodology evolves.

TradeChartist Tantalizer Pro™TradeChartist Tantalizer Pro is an extensive set of trading Indicators, Signal generators and Utilities all packed into 1 script. The script's visually appealing design and its functionality offers a pleasing experience for the users, thereby complementing their analysis and helps understand asset's price action better.
What does ™TradeChartist Tantalizer Pro do?
1. MA Tantalizer plots Moving Averages Tantalizer (Fishnet or Tantalized) based on user selection from a dropdown of 10 MAs (SMA, EMA, Zero-Lag EMA, SMMA, WMA, DEMA, TEMA, VIDYA (Variable Index DYnamic Average), T3 MA (developed by Tim Tillson featured in his article "Better Moving Averages" in 1998), Modified T3 MA). If length input is 10, Tantalizer plots 20 MA plots ranging from 10 MA to 200 MA. The Tantalized MAs help the traders to visually spot price trends and along with other indicators within the script, helps make an informed trade decision. 20 MA plots can be individually plotted or hidden from the indicator settings.
2. Plots two MAs based on user input length and timeframe which helps detect MA crosses as shown below.
3. Generates Intensity framework based Signals with recommended Stop Loss (trails with Equilibrium Line) along with Intensity Bands plot. (disables MA Tantalizer)
4. Plots Intensity candles to help spot trend and trend changes.
5. Generates TradeChartist's Rubicon framework based signals with recommended Stop Loss (trails and reverses trade when closes below or above, based on trade direction) along with Rubicon Environment plot.
6. Offers RSI color candles, Automatic Levels Generator in the toolkit to help traders visually spot RSI changes and Support/Resistance levels on chart. RSI Color Candles is a very helpful tool especially in spotting price trends on Heikin Ashi charts.
The sheer number of interesting things that can be done with this script from plotting visually engaging MA Tantalizer, detecting MA crosses not just on chart Timeframe, but also crosses between MAs of different timeframes, switching between Rubicon and Intensity environments, switching between RSI and Intensity color candles to plotting Support/Resistance levels using Automatic Levels Generator, makes this script quite versatile and a real Tantalizer.
This is not a free to use indicator. Get in touch with me (PM me directly if you would like trial access to the indicator before deciding to take lifetime access to this script)
Premium Scripts - Trial access and Information
Trial access offered on all Premium scripts.
PM me directly to request trial access to the scripts or for more information.

Weis zigzag delta Jayy Dec 09 19This is an update of my Weis Wave script. The script is protected however you do not need permission to use the script. There are additions to this script from the one posted here: Please read the notes associated with that script as well as the videos.
Watch the following video to familiarize yourself with the use of both Weis scripts:
Jayy

Cryptocurrency trend following EMA Ribbon LONG only studyThis strategy is based on EMA Ribbon and uses multiple indicators to find optimal time to enter/exit the trade and filter out false signals. The script with default setting is developed mainly for trading altcoins/stable coin pair such as ADA(USDT etc on 4h timeframe but it can be applied to any pair/any timeframe with some settings adjustments.
For plot on chart features make sure that you have both study and strategy scripts on chart with same settings.
Strategy settings description:
1. Signal EMA Length - Value for exponencial moving average (slowest from EMA Ribbon)
1a. Buy price toleration (%) - Price deviation for filtering bounces of EMA - price must close defined percents above EMA to open long trade
1b. Sell price toleration (%) - Price deviation for filtering bounces of EMA - price must close defined percents bellow EMA to close long trade
1c. EMA deelay - EMA id delayed by defined bars for smoothening
2. Filter by Fast EMA - Strategy filters signals to prevent buy while coin is dropping
2a. Fast EMA Length - Value for fast exponencial moving average
3. Filter by SMA - Strategy filters signals to confirm trend change
3a. SMA Length - Value for simple moving average
4. Filter by RSI - Strategy filters signals to prevent buing/selling overbought/oversold coins
4a. RSI Length - Length of RSI identificator
4b. RSI Source candle - What price of candle is used for RSI calculation (open, close, high, low)
4c. RSI Long condition - When buy, RSI indicator must be below this value to prevent of buying already overbought coin
4d. RSI Short condition - When sell, RSI indicator must be above this value to prevent of selling already oversold coin
5. RSI Close Trade Condition - Strategy sell coin once RSI reach defined value
5a. RSI close trade condition - Sell once RSI indicator acquires defined value
6. Close trade by Take Profit or Stop Loss Condition (STRATEGY ONLY) - Strategy sell coin once defined take profit / stoploss level is reached
6a. Take Profit (%) - Take profit value in percent
6b. Stop Loss (%) - Stop loss value in percent
6c. Plot targets on chart - defined targets will be plotted as lines on chart
7. Date range from
7a From Year - To run strategy in interval
7b From Month - To run strategy in interval
7c From Day - To run strategy in interval
8. Date range to
8a To Year - To run strategy in interval
8b To Month - To run strategy in interval
8c To Day - To run strategy in interval
9. Wait to confirm the signal
9a Wait candless to buy - strategy will wait defined candless to confirm the signal before buy
9b Wait candless to sell - strategy will wait defined candless to confirm the signal before sell
10. Plotting on chart (STUDY ONLY)
10a Plot signal line channel with bows on chart
10b Plot simple moving average on chart
10c Plot EMA Ribbon on chart
10d Plot recent support and resistance levels on chart
11. Show Every signal (STUDY ONLY) - Unchecked shows only first signal based on strategy. But if you use take profit/stoploss settings within your bot, you might want to rebuy on next signal. Checked shows signal on each candle.
Throw on chart also buld-in RSI indicator and set the same as strategy
Notice that there might be false signals, especially when the coin is not trending or is strongly manipulated. Overall strategy is profitable though. You just take some minor loses and wont miss the big move.
You may also consider to compare buy&hold return vs profit from trading this strategy. In downtrend as we have seen recently, profit may not be as high as you expect but it is still much better than just hold and hope.
You can use the strategy script for fine tunning settings and find best settings for yourself.
Study script helps you to automate trading with use of alerts perharps with 3commas bot or even trade manually based on email/sms notification setted by tradingview
Notice that study script does not handle takeprofit/stoploss order. That is why sell arrows could be plotted by study script later than strategy script. To rebuy after takeprofit/stop-loss use "11. Show Every signal (STUDY ONLY)" setting
Make sure that you keep same settings for strategy and study scripts.
If you need any help with settings do not hesitate to ask. I would also appriciate any feedback and ideas how to improve this script.
Here is backtest result from 1. Nov 2018 using constant 100USD Buy ammount:
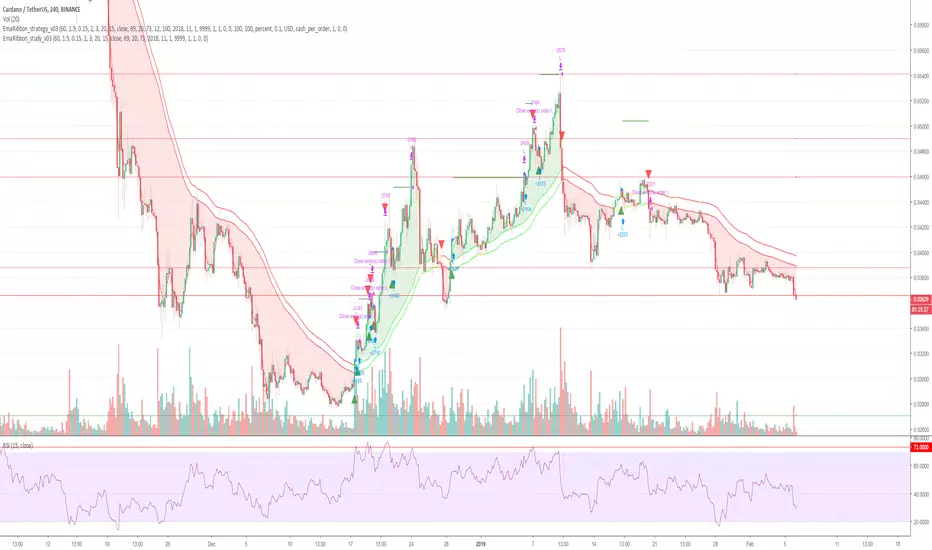
Cryptocurrency trend following EMA Ribbon LONG only strategyThis strategy is based on EMA Ribbon and uses multiple indicators to find optimal time to enter/exit the trade and filter out false signals. The script with default setting is developed mainly for trading altcoins/stable coin pair such as ADA/USDT etc on 4h timeframe but it can be applied to any pair/any timeframe with some settings adjustments.
For plot on chart features make sure that you have both study and strategy scripts on chart with same settings.
Strategy settings description:
1. Signal EMA Length - Value for exponencial moving average (slowest from EMA Ribbon)
1a. Buy price toleration (%) - Price deviation for filtering bounces of EMA - price must close defined percents above EMA to open long trade
1b. Sell price toleration (%) - Price deviation for filtering bounces of EMA - price must close defined percents bellow EMA to close long trade
1c. EMA deelay - EMA id delayed by defined bars for smoothening
2. Filter by Fast EMA - Strategy filters signals to prevent buy while coin is dropping
2a. Fast EMA Length - Value for fast exponencial moving average
3. Filter by SMA - Strategy filters signals to confirm trend change
3a. SMA Length - Value for simple moving average
4. Filter by RSI - Strategy filters signals to prevent buing/selling overbought/oversold coins
4a. RSI Length - Length of RSI identificator
4b. RSI Source candle - What price of candle is used for RSI calculation (open, close, high, low)
4c. RSI Long condition - When buy, RSI indicator must be below this value to prevent of buying already overbought coin
4d. RSI Short condition - When sell, RSI indicator must be above this value to prevent of selling already oversold coin
5. RSI Close Trade Condition - Strategy sell coin once RSI reach defined value
5a. RSI close trade condition - Sell once RSI indicator acquires defined value
6. Close trade by Take Profit or Stop Loss Condition (STRATEGY ONLY) - Strategy sell coin once defined take profit / stoploss level is reached
6a. Take Profit (%) - Take profit value in percent
6b. Stop Loss (%) - Stop loss value in percent
6c. Plot targets on chart - defined targets will be plotted as lines on chart
7. Date range from
7a From Year - To run strategy in interval
7b From Month - To run strategy in interval
7c From Day - To run strategy in interval
8. Date range to
8a To Year - To run strategy in interval
8b To Month - To run strategy in interval
8c To Day - To run strategy in interval
9. Wait to confirm the signal
9a Wait candless to buy - strategy will wait defined candless to confirm the signal before buy
9b Wait candless to sell - strategy will wait defined candless to confirm the signal before sell
10. Plotting on chart (STUDY ONLY)
10a Plot signal line channel with bows on chart
10b Plot simple moving average on chart
10c Plot EMA Ribbon on chart
10d Plot recent support and resistance levels on chart
11. Show Every signal (STUDY ONLY) - Unchecked shows only first signal based on strategy. But if you use take profit/stoploss settings within your bot, you might want to rebuy on next signal. Checked shows signal on each candle.
Throw on chart also buld-in RSI indicator and set the same as strategy
Notice that there might be false signals, especially when the coin is not trending or is strongly manipulated. Overall strategy is profitable though. You just take some minor loses and wont miss the big move.
You may also consider to compare buy&hold return vs profit from trading this strategy. In downtrend as we have seen recently, profit may not be as high as you expect but it is still much better than just hold and hope.
You can use the strategy script for fine tunning settings and find best settings for yourself.
Study script helps you to automate trading with use of alerts perharps with 3commas bot or even trade manually based on email/sms notification setted by tradingview
Notice that study script does not handle takeprofit/stoploss order. That is why sell arrows could be plotted by study script later than strategy script. To rebuy after takeprofit/stop-loss use "11. Show Every signal (STUDY ONLY)" setting
Make sure that you keep same settings for strategy and study scripts.
If you need any help with settings do not hesitate to ask. I would also appriciate any feedback and ideas how to improve this script.
Here is backtest result from 1. Nov 2018 using constant 100USD Buy ammount:

COMET_Scanner_Library_FINALLibrary "COMET_Scanner_Library"
- A Trader's Edge (ATE)_Library was created to assist in constructing COM Scanners
TickerIDs(_string)
TickerIDs: You must form this single tickerID input string exactly as described in the scripts info panel (little gray 'i' that
is circled at the end of the settings in the settings/input panel that you can hover your cursor over this 'i' to read the
details of that particular input). IF the string is formed correctly then it will break up this single string parameter into
a total of 40 separate strings which will be all of the tickerIDs that the script is using in your COM Scanner.
Parameters:
_string (simple string) : (string)
A maximum of 40 Tickers (ALL joined as 1 string for the input parameter) that is formulated EXACTLY as described
within the tooltips of the TickerID inputs in my COM Scanner scripts:
assets = input.text_area(tIDs, title="TickerIDs (MUST READ TOOLTIP)", group=g2, tooltip="Accepts 40 TICKERID's
for each copy of the script on the chart. \n\n*** MUST FORMAT THIS WAY ***\n\n Each FULL tickerID
(ie 'Exchange:ticker') must be separated by A SINGLE BLANK SPACE for correct formatting. The blank space tells
the script where to break off the ticker to assign it to a variable to be used later in the script. So this input
will be a single string constructed from up to 40 tickerID's with a space between each tickerID
(ie. 'BINANCE:BTCUSDT BINANCE:SXPUSDT BINANCE:XRPUSDT').", display=display.none)
Returns: Returns 40 output variables in the tuple (ie. between the ' ') with the separated TickerIDs,
Locations(_firstLocation)
Locations: This function is used when there's a desire to print an assets ALERT LABELS. A set Location on the scale is assigned to each asset.
This is created so that if a lot of alerts are triggered, they will stay relatively visible and not overlap each other.
If you set your '_firstLocation' parameter as 1, since there are a max of 40 assets that can be scanned, the 1st asset's location
is assigned the value in the '_firstLocation' parameter, the 2nd asset's location is the (1st asset's location+1)...and so on.
Parameters:
_firstLocation (simple int) : (simple int)
Optional (starts at 1 if no parameter added).
Location that you want the first asset to print its label if is triggered to do so.
ie. loc2=loc1+1, loc3=loc2+1, etc.
Returns: Returns 40 variables for the locations for alert labels
LabelSize(_barCnt, _lblSzRfrnce)
INVALID TICKERIDs: This is to add a table in the middle right of your chart that prints all the TickerID's that were either not formulated
correctly in the '_source' input or that is not a valid symbol and should be changed.
LABEL SIZES: This function sizes your Alert Trigger Labels according to the amount of Printed Bars the chart has printed within
a set time period, while also keeping in mind the smallest relative reference size you input in the 'lblSzRfrnceInput'
parameter of this function. A HIGHER % of Printed Bars(aka...more trades occurring for that asset on the exchange),
the LARGER the Name Label will print, potentially showing you the better opportunities on the exchange to avoid
exchange manipulation liquidations.
*** SHOULD NOT be used as size of labels that are your asset Name Labels next to each asset's Line Plot...
if your COM Scanner includes these as you want these to be the same size for every asset so the larger ones dont cover the
smaller ones if the plots are all close to each other ***
Parameters:
_barCnt (float) : (float)
Get the 1st variable('barCnt') from the Security function's tuple and input it as this functions 1st input
parameter which will directly affect the size of the 2nd output variable ('alertTrigLabel') that is also outputted by this function.
_lblSzRfrnce (string) : (string)
Optional (if parameter not included, it defaults to size.small). This will be the size of the variable outputted
by this function named 'assetNameLabel' BUT also affects the size of the output variable 'alertTrigLabel' as it uses this parameter's size
as the smallest size for 'alertTrigLabel' then uses the '_barCnt' parameter to determine the next sizes up depending on the "_barCnt" value.
Returns: ( )
Returns 2 variables:
1st output variable ('AssetNameLabel') is assigned to the size of the 'lblSzRfrnceInput' parameter.
2nd output variable('alertTrigLabel') can be of variying sizes depending on the 'barCnt' parameter...BUT the smallest
size possible for the 2nd output variable ('alertTrigLabel') will be the size set in the 'lblSzRfrnceInput' parameter.
InvalidTickerIDs(_close, _securityTickerid, _invalidArray, _tablePosition, _stackVertical)
Parameters:
_close (float)
_securityTickerid (string)
_invalidArray (array)
_tablePosition (simple string)
_stackVertical (simple bool)
PrintedBarCount(_time, _barCntLength, _barCntPercentMin)
The Printed BarCount Filter looks back a User Defined amount of minutes and calculates the % of bars that have printed
out of the TOTAL amount of bars that COULD HAVE been printed within the same amount of time.
Parameters:
_time (int) : (int)
The time associated with the chart of the particular asset that is being screened at that point.
_barCntLength (int) : (int)
The amount of time (IN MINUTES) that you want the logic to look back at to calculate the % of bars that have actually
printed in the span of time you input into this parameter.
_barCntPercentMin (int) : (int)
The minimum % of Printed Bars of the asset being screened has to be GREATER than the value set in this parameter
for the output variable 'bc_gtg' to be true.
Returns: ( )
Returns 2 outputs:
1st is the % of Printed Bars that have printed within the within the span of time you input in the '_barCntLength' parameter.
2nd is true/false according to if the Printed BarCount % is above the threshold that you input into the '_barCntPercentMin' parameter.

COM_Scanner_LibraryLibrary "COM_Scanner_Library"
- A Trader's Edge (ATE)_Library was created to assist in constructing COM Scanners
TickerIDs(_string)
TickerIDs: You must form this single tickerID input string exactly as described in the scripts info panel (little gray 'i' that
is circled at the end of the settings in the settings/input panel that you can hover your cursor over this 'i' to read the
details of that particular input). IF the string is formed correctly then it will break up this single string parameter into
a total of 40 separate strings which will be all of the tickerIDs that the script is using in your COM Scanner.
Parameters:
_string (simple string) : (string)
A maximum of 40 Tickers (ALL joined as 1 string for the input parameter) that is formulated EXACTLY as described
within the tooltips of the TickerID inputs in my COM Scanner scripts:
assets = input.text_area(tIDs, title="TickerIDs (MUST READ TOOLTIP)", group=g2, tooltip="Accepts 40 TICKERID's
for each copy of the script on the chart. \n\n*** MUST FORMAT THIS WAY ***\n\n Each FULL tickerID
(ie 'Exchange:ticker') must be separated by A SINGLE BLANK SPACE for correct formatting. The blank space tells
the script where to break off the ticker to assign it to a variable to be used later in the script. So this input
will be a single string constructed from up to 40 tickerID's with a space between each tickerID
(ie. 'BINANCE:BTCUSDT BINANCE:SXPUSDT BINANCE:XRPUSDT').", display=display.none)
Returns: Returns 40 output variables in the tuple (ie. between the ' ') with the separated TickerIDs,
Locations(_firstLocation)
Locations: This function is used when there's a desire to print an assets ALERT LABELS. A set Location on the scale is assigned to each asset.
This is created so that if a lot of alerts are triggered, they will stay relatively visible and not overlap each other.
If you set your '_firstLocation' parameter as 1, since there are a max of 40 assets that can be scanned, the 1st asset's location
is assigned the value in the '_firstLocation' parameter, the 2nd asset's location is the (1st asset's location+1)...and so on.
Parameters:
_firstLocation (simple int) : (simple int)
Optional (starts at 1 if no parameter added).
Location that you want the first asset to print its label if is triggered to do so.
ie. loc2=loc1+1, loc3=loc2+1, etc.
Returns: Returns 40 variables for the locations for alert labels
LabelSize(_barCnt, _lblSzRfrnce)
INVALID TICKERIDs: This is to add a table in the middle right of your chart that prints all the TickerID's that were either not formulated
correctly in the '_source' input or that is not a valid symbol and should be changed.
LABEL SIZES: This function sizes your Alert Trigger Labels according to the amount of Printed Bars the chart has printed within
a set time period, while also keeping in mind the smallest relative reference size you input in the 'lblSzRfrnceInput'
parameter of this function. A HIGHER % of Printed Bars(aka...more trades occurring for that asset on the exchange),
the LARGER the Name Label will print, potentially showing you the better opportunities on the exchange to avoid
exchange manipulation liquidations.
*** SHOULD NOT be used as size of labels that are your asset Name Labels next to each asset's Line Plot...
if your COM Scanner includes these as you want these to be the same size for every asset so the larger ones dont cover the
smaller ones if the plots are all close to each other ***
Parameters:
_barCnt (float) : (float)
Get the 1st variable('barCnt') from the Security function's tuple and input it as this functions 1st input
parameter which will directly affect the size of the 2nd output variable ('alertTrigLabel') that is also outputted by this function.
_lblSzRfrnce (string) : (string)
Optional (if parameter not included, it defaults to size.small). This will be the size of the variable outputted
by this function named 'assetNameLabel' BUT also affects the size of the output variable 'alertTrigLabel' as it uses this parameter's size
as the smallest size for 'alertTrigLabel' then uses the '_barCnt' parameter to determine the next sizes up depending on the "_barCnt" value.
Returns: ( )
Returns 2 variables:
1st output variable ('AssetNameLabel') is assigned to the size of the 'lblSzRfrnceInput' parameter.
2nd output variable('alertTrigLabel') can be of variying sizes depending on the 'barCnt' parameter...BUT the smallest
size possible for the 2nd output variable ('alertTrigLabel') will be the size set in the 'lblSzRfrnceInput' parameter.
InvalidTickerIDs(_close, _securityTickerid, _invalidArray, _tablePosition, _stackVertical)
Parameters:
_close (float)
_securityTickerid (string)
_invalidArray (array)
_tablePosition (simple string)
_stackVertical (simple bool)
PrintedBarCount(_time, _barCntLength, _barCntPercentMin)
The Printed BarCount Filter looks back a User Defined amount of minutes and calculates the % of bars that have printed
out of the TOTAL amount of bars that COULD HAVE been printed within the same amount of time.
Parameters:
_time (int) : (int)
The time associated with the chart of the particular asset that is being screened at that point.
_barCntLength (int) : (int)
The amount of time (IN MINUTES) that you want the logic to look back at to calculate the % of bars that have actually
printed in the span of time you input into this parameter.
_barCntPercentMin (int) : (int)
The minimum % of Printed Bars of the asset being screened has to be GREATER than the value set in this parameter
for the output variable 'bc_gtg' to be true.
Returns: ( )
Returns 2 outputs:
1st is the % of Printed Bars that have printed within the within the span of time you input in the '_barCntLength' parameter.
2nd is true/false according to if the Printed BarCount % is above the threshold that you input into the '_barCntPercentMin' parameter.
MarubozuMarubozu:
This code is written to identify the Marubozu candles in three different timeframe (30, 45, 60) - and there is an option given to the user for modifying the timeframe according to their wish.
Step to work with this script:
1. The three timeframe will work like this, If you select in chart 15mins - the three levels that you can select are 30, 45, 60, but if you select higher value like 30mins in the chart - you cannot select 45mins as there is a restriction on the code as it will display on the script of divisible by the timeframe selected in the chart.
2. Moving Average 100 is used along with the trend to see whether the immediate trend of the script is negative or positive which will help in taking the script for long or short.
Rules:
1. Always select the timeframe as 15mins in the chart and get the levels from the script.. Mark them in your chart as permanent levels and you can hide the script for further use, and don't reduce the timeframe to 5mins as the level gets changed.
2. The script will identify the High and low of the Marubozu and draws the horizontal line to help the users to see the support and resistance for the script.
3. Always try to trade above the 100sma and marubozu levels at the bottom - and don't look out for the trade where the SMA is very near to resistance or support (when you are short)
CVD - Cumulative Volume Delta (Chart)█ OVERVIEW
This indicator displays cumulative volume delta (CVD) as an on-chart oscillator. It uses intrabar analysis to obtain more precise volume delta information compared to methods that only use the chart's timeframe.
The core concepts in this script come from our first CVD indicator , which displays CVD values as plot candles in a separate indicator pane. In this script, CVD values are scaled according to price ranges and represented on the main chart pane.
█ CONCEPTS
Bar polarity
Bar polarity refers to the position of the close price relative to the open price. In other words, bar polarity is the direction of price change.
Intrabars
Intrabars are chart bars at a lower timeframe than the chart's. Each 1H chart bar of a 24x7 market will, for example, usually contain 60 bars at the lower timeframe of 1min, provided there was market activity during each minute of the hour. Mining information from intrabars can be useful in that it offers traders visibility on the activity inside a chart bar.
Lower timeframes (LTFs)
A lower timeframe is a timeframe that is smaller than the chart's timeframe. This script utilizes a LTF to analyze intrabars, or price changes within a chart bar. The lower the LTF, the more intrabars are analyzed, but the less chart bars can display information due to the limited number of intrabars that can be analyzed.
Volume delta
Volume delta is a measure that separates volume into "up" and "down" parts, then takes the difference to estimate the net demand for the asset. This approach gives traders a more detailed insight when analyzing volume and market sentiment. There are several methods for determining whether an asset's volume belongs in the "up" or "down" category. Some indicators, such as On Balance Volume and the Klinger Oscillator , use the change in price between bars to assign volume values to the appropriate category. Others, such as Chaikin Money Flow , make assumptions based on open, high, low, and close prices. The most accurate method involves using tick data to determine whether each transaction occurred at the bid or ask price and assigning the volume value to the appropriate category accordingly. However, this method requires a large amount of data on historical bars, which can limit the historical depth of charts and the number of symbols for which tick data is available.
In the context where historical tick data is not yet available on TradingView, intrabar analysis is the most precise technique to calculate volume delta on historical bars on our charts. This indicator uses intrabar analysis to achieve a compromise between simplicity and accuracy in calculating volume delta on historical bars. Our Volume Profile indicators use it as well. Other volume delta indicators in our Community Scripts , such as the Realtime 5D Profile , use real-time chart updates to achieve more precise volume delta calculations. However, these indicators aren't suitable for analyzing historical bars since they only work for real-time analysis.
This is the logic we use to assign intrabar volume to the "up" or "down" category:
• If the intrabar's open and close values are different, their relative position is used.
• If the intrabar's open and close values are the same, the difference between the intrabar's close and the previous intrabar's close is used.
• As a last resort, when there is no movement during an intrabar and it closes at the same price as the previous intrabar, the last known polarity is used.
Once all intrabars comprising a chart bar are analyzed, we calculate the net difference between "up" and "down" intrabar volume to produce the volume delta for the chart bar.
█ FEATURES
CVD resets
The "cumulative" part of the indicator's name stems from the fact that calculations accumulate during a period of time. By periodically resetting the volume delta accumulation, we can analyze the progression of volume delta across manageable chunks, which is often more useful than looking at volume delta accumulated from the beginning of a chart's history.
You can configure the reset period using the "CVD Resets" input, which offers the following selections:
• None : Calculations do not reset.
• On a fixed higher timeframe : Calculations reset on the higher timeframe you select in the "Fixed higher timeframe" field.
• At a fixed time that you specify.
• At the beginning of the regular session .
• On trend changes : Calculations reset on the direction change of either the Aroon indicator, Parabolic SAR , or Supertrend .
• On a stepped higher timeframe : Calculations reset on a higher timeframe automatically stepped using the chart's timeframe and following these rules:
Chart TF HTF
< 1min 1H
< 3H 1D
<= 12H 1W
< 1W 1M
>= 1W 1Y
Specifying intrabar precision
Ten options are included in the script to control the number of intrabars used per chart bar for calculations. The greater the number of intrabars per chart bar, the fewer chart bars can be analyzed.
The first five options allow users to specify the approximate amount of chart bars to be covered:
• Least Precise (Most chart bars) : Covers all chart bars by dividing the current timeframe by four.
This ensures the highest level of intrabar precision while achieving complete coverage for the dataset.
• Less Precise (Some chart bars) & More Precise (Less chart bars) : These options calculate a stepped LTF in relation to the current chart's timeframe.
• Very precise (2min intrabars) : Uses the second highest quantity of intrabars possible with the 2min LTF.
• Most precise (1min intrabars) : Uses the maximum quantity of intrabars possible with the 1min LTF.
The stepped lower timeframe for "Less Precise" and "More Precise" options is calculated from the current chart's timeframe as follows:
Chart Timeframe Lower Timeframe
Less Precise More Precise
< 1hr 1min 1min
< 1D 15min 1min
< 1W 2hr 30min
> 1W 1D 60min
The last five options allow users to specify an approximate fixed number of intrabars to analyze per chart bar. The available choices are 12, 24, 50, 100, and 250. The script will calculate the LTF which most closely approximates the specified number of intrabars per chart bar. Keep in mind that due to factors such as the length of a ticker's sessions and rounding of the LTF, it is not always possible to produce the exact number specified. However, the script will do its best to get as close to the value as possible.
As there is a limit to the number of intrabars that can be analyzed by a script, a tradeoff occurs between the number of intrabars analyzed per chart bar and the chart bars for which calculations are possible.
Display
This script displays raw or cumulative volume delta values on the chart as either line or histogram oscillator zones scaled according to the price chart, allowing traders to visualize volume activity on each bar or cumulatively over time. The indicator's background shows where CVD resets occur, demarcating the beginning of new zones. The vertical axis of each oscillator zone is scaled relative to the one with the highest price range, and the oscillator values are scaled relative to the highest volume delta. A vertical offset is applied to each oscillator zone so that the highest oscillator value aligns with the lowest price. This method ensures an accurate, intuitive visual comparison of volume activity within zones, as the scale is consistent across the chart, and oscillator values sit below prices. The vertical scale of oscillator zones can be adjusted using the "Zone Height" input in the script settings.
This script displays labels at the highest and lowest oscillator values in each zone, which can be enabled using the "Hi/Lo Labels" input in the "Visuals" section of the script settings. Additionally, the oscillator's value on a chart bar is displayed as a tooltip when a user hovers over the bar, which can be enabled using the "Value Tooltips" input.
Divergences occur when the polarity of volume delta does not match that of the chart bar. The script displays divergences as bar colors and background colors that can be enabled using the "Color bars on divergences" and "Color background on divergences" inputs.
An information box in the lower-left corner of the indicator displays the HTF used for resets, the LTF used for intrabars, the average quantity of intrabars per chart bar, and the number of chart bars for which there is LTF data. This is enabled using the "Show information box" input in the "Visuals" section of the script settings.
FOR Pine Script™ CODERS
• This script utilizes `ltf()` and `ltfStats()` from the lower_tf library.
The `ltf()` function determines the appropriate lower timeframe from the selected calculation mode and chart timeframe, and returns it in a format that can be used with request.security_lower_tf() .
The `ltfStats()` function, on the other hand, is used to compute and display statistical information about the lower timeframe in an information box.
• The script utilizes display.data_window and display.status_line to restrict the display of certain plots.
These new built-ins allow coders to fine-tune where a script’s plot values are displayed.
• The newly added session.isfirstbar_regular built-in allows for resetting the CVD segments at the start of the regular session.
• The VisibleChart library developed by our resident PineCoders team leverages the chart.left_visible_bar_time and chart.right_visible_bar_time variables to optimize the performance of this script.
These variables identify the opening time of the leftmost and rightmost visible bars on the chart, allowing the script to recalculate and draw objects only within the range of visible bars as the user scrolls.
This functionality also enables the scaling of the oscillator zones.
These variables are just a couple of the many new built-ins available in the chart.* namespace.
For more information, check out this blog post or look them up by typing "chart." in the Pine Script™ Reference Manual .
• Our ta library has undergone significant updates recently, including the incorporation of the `aroon()` indicator used as a method for resetting CVD segments within this script.
Revisit the library to see more of the newly added content!
Look first. Then leap.
